If you want to create a dashboard where you want Day-wise reports of week-on-week reports or month-on-month stats, then you can follow the below steps.
Here’s a very simple demo of what it’ll look like:
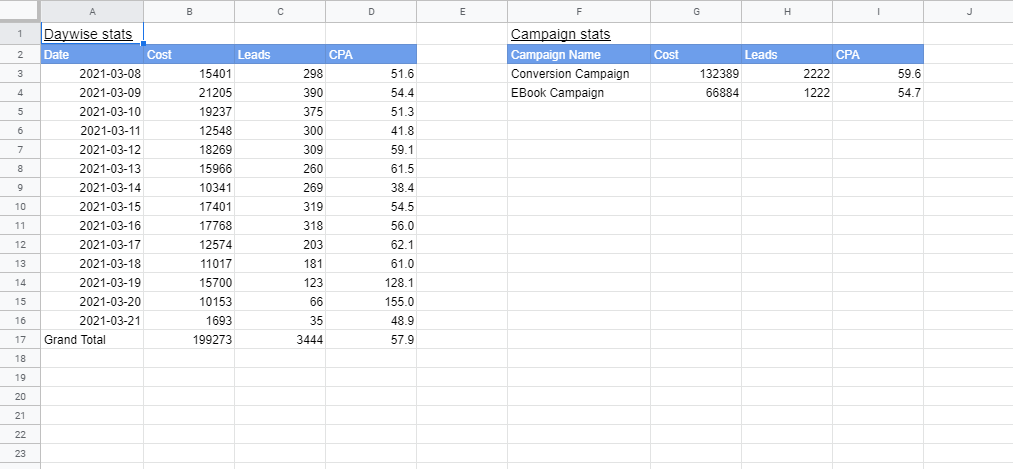
It contains 2 tables
- Daywise Stats
- Campaign Stats
Note: These will be updated automatically every day and will keep on adding new dates and also new campaigns.
So let’s begin
STEP – 1: Export Raw Data in Sheet
We have selected a single facebook account. Then select a dynamic date range (Eg: Last X days) and split it by date
Then select your required fields. Make sure to have “Date” as a first field. (We have selected fields as shown in an image)
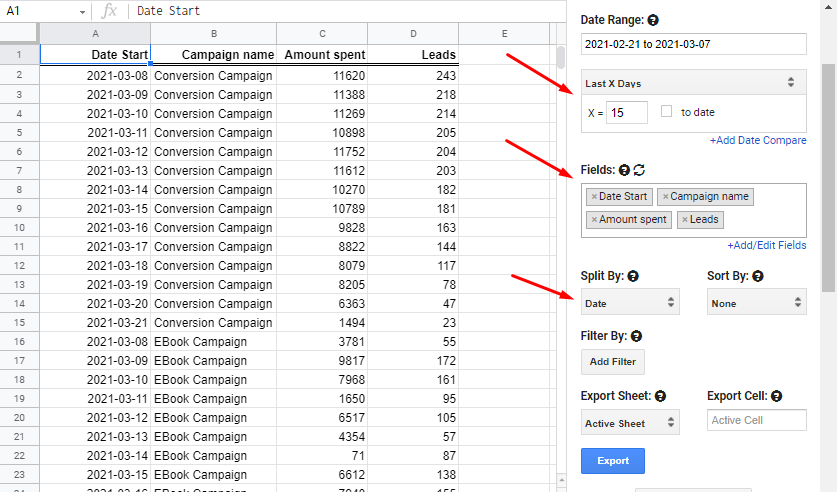
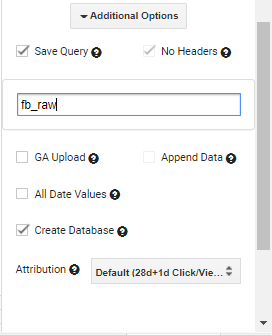
Lastly, check the create database checkbox and the save query And click on Export Data.
Once done, you will see the output in cell A1 with datewise stat. You can rename this sheet as RAW_FB, as we won’t be creating dashboards in this sheet.
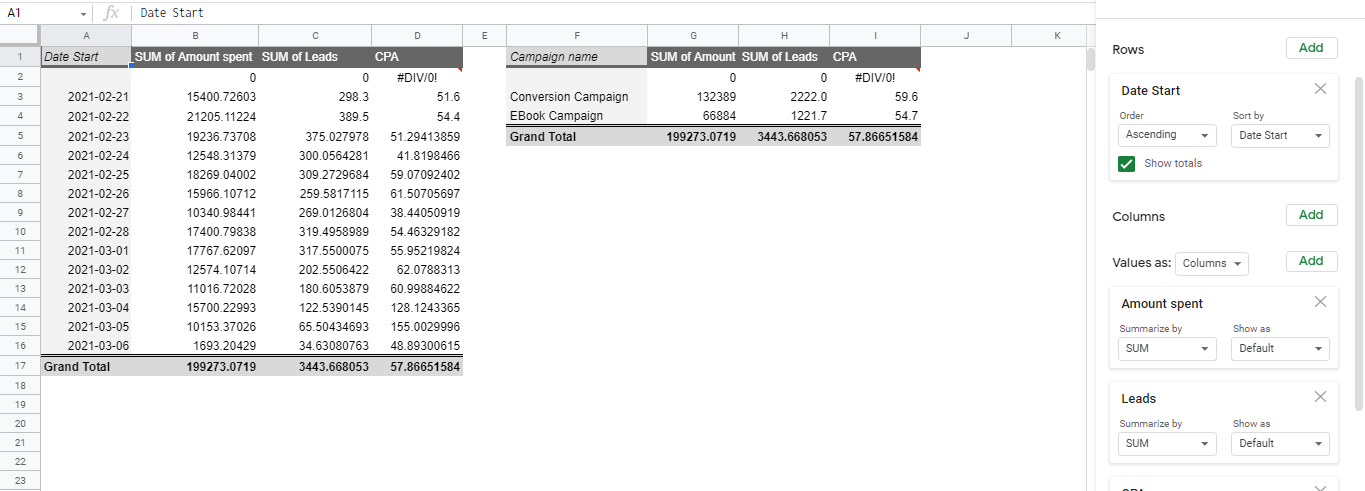
STEP – 2: Create Pivot Table
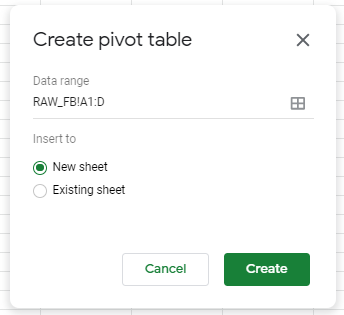
In the spreadsheet menu, click on Data > Pivot Table. Click on create.
NOTE: Make sure to remove any integer after D. So for eg we have A1:D. (This will select the entire rows from A to D)
In the pivot table, we have added the Rows as date Start and Values as Amount Spent, Leads, and CPA (Custom Value which is Amount spent / leads)
We have also created 2nd pivot table with Rows as campaign name to get overall campaign stats.
STEP – 3: Create Dashboard Sheet
Now finally, you can create a new sheet where you can import values into your dashboard.
We have simply used an array formula to import some data range from the pivot tables.
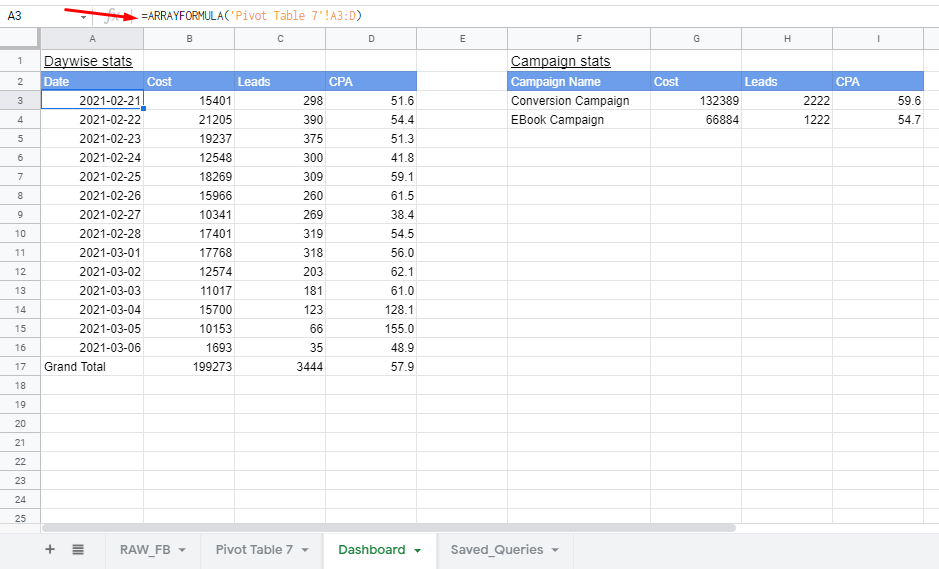
Also, when you schedule the report the raw sheet will get updated which in turn will update your dashboard.
How To View Week On Week And Month on Month Reports?
For week on week reports, you can simply follow the above steps till exporting Raw data
Then to add an extra columns in Raw data you can simply, leave an empty column to the right and then add the new columns
For Eg: We have added Start Of Week and Month as a new column in RAW sheet. Formulas are as follows:
- Start of Week : =ArrayFormula(if(A2:A = “”,“”, A2:A – WEEKDAY(A2:A, 1)))
- Month : =ArrayFormula(if(B2:B = “”,“”, TEXT(A2:A,“mm”)))
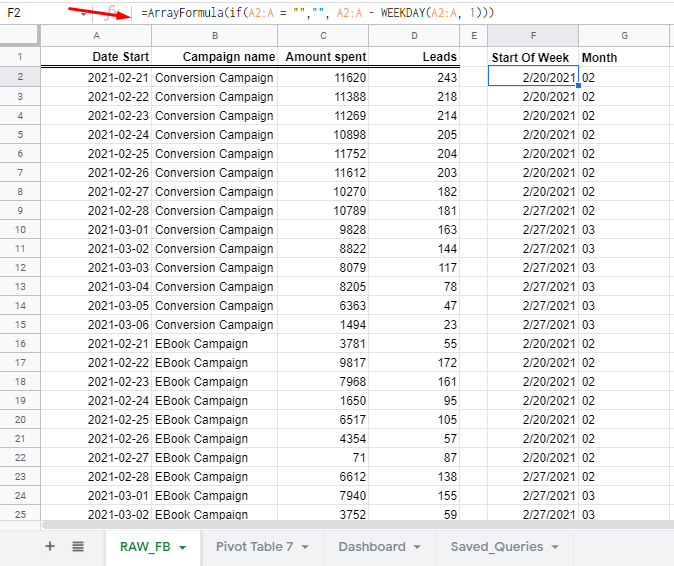
Now you can simply update the Range in Pivot table as A1:G. Then add Start of the week to get a week-on-week report and Month to get the month-on-month report.