Last Updated on May 25, 2019 by Ritwik B
If you’re working in a digital niche for quite a while, there are few web analytics metrics that you should probably know by now.
Some of these metrics are so important that they define the KPIs for different departments of your organization & also predict the future of your business.
In this article, we’ll be focusing on everything related to web analytics metrics, starting with the MOST IMPORTANT ones.
So here we go…
Index
What are the MOST IMPORTANT Web Analytics Metrics?
As per the Web Analytics Association (WAA) Standard, the top 3 MOST IMPORTANT Web Analytics metrics are
- Unique Visitors
- Visits / Session
- Pageviews
Different web analytics tools may reference it differently but these metrics form the basic foundation for the most web analytics definition.
So let’s take a look at how these are defined.
1.) Unique Visitors
In simple terms,
Unique visitors are the number of unique users within a specified timeframe.
Most of the web analytics tools refer to it as “Users” & they use cookies to store the user identification value. Google Analytics uses ‘clientID’ to store anonymous user information.
These unique visitors are then further classified into:
- New Visitor
- Repeat Visitor
- Return Visitor
New Visitor: The visitor who visit your website for the first time in a specified timeframe.
Repeat Visitor: The number of unique visitors who have 2 or more visits to your website in a given timeframe.
Return Visitor: The number of Unique visitors who visit your website in the given timeframe & who visited the website before the specified timeframe.
2.) Visits / Session
It is a ratio metric which includes visits & sessions. Let’s understand these
Visit is any user interaction with your website within a specified timeframe.
Sessions is a group of user interaction within a specified timeframe.
The session timeout period is usually 30min & it is configurable in most web analytics tools.
Some of the interactions are:
- Pageviews
- Events
- Ecommerce Hits
- Timing Hits
- etc…
3.) Pageview
The number of times a page (or any viewable content) was loaded.
It is a very basic metric & is tracked by most of the web analytics tools by default. For apps, the corresponding metric is screen view.
Also, for Single Page applications, you can track page views by sending a hit to your web analytics tools. Do check out the docs for the same.
Categorization of Web Analytics Metrics
Different tools have categorized web analytics metrics differently. Be it google analytics, mixpanel, amplitude, facebook analytics & so on…
Let’s look at the categorization of the web analytics metrics
1.) By Digital Analytics Association
But, The Digital Analytics Association has defined & categorized the most foundational web analytics metrics as follow. This will help you to benchmark & compare with the analytics vendor’s metrics. Let’s have a look at it.
- Building Block Terms
- Visit Characterization
- Content Characterization
- Conversion Metrics
**NOTE: Hover over the metrics for the definition.
| Category | Metrics |
|---|---|
| Building Block Terms |
|
| Visit Characterization |
|
| Content Characterization |
|
| Conversion Metrics |
|
2.) By Google Analytics
All of you must be aware of the “AABC” model which google analytics uses to categorize the web metrics & dimensions for their reports.
“AABC” stands for:
Audience, Acquisition, Behavior & Conversion
Let’s summarize these reports:
- Audience: It includes all the information or attributes related to the users visiting your website.
- Country, New vs Returning Users, Age, Gender, etc…
- Acquisition: It includes all the information related to where the user came from.
- Source, Medium, Referrer, Users, Sessions, etc
- Behavior: It includes metrics related to your website engagement.
- Page, Pageviews, Unique Pageviews, Avg. Time on Page, Exit Page, etc
- Conversion: It includes metrics related to the goals of your site.
- Goal, Goal value, Value / Session, Ecomm. Transactions, Revenue, etc
How Is The Data For The Web Analytics Metrics Collected?
There are mainly 2 methods of collecting the data.
- Web Server Log Files
- Page Tagging.
Let’s have a quick look at these.
1.) Web Server Log Files
This is the old traditional method where the web server records the requests in the log file. By analyzing these log files we used to get a number of insights such as:
- Pageview: Request made for a page to the web server
- Visit: Sequence of requests made by a particular client that expired after some amount of inactivity, (30 min)
- & so on….
Let’s look at some pros & cons of these methods.
Pros:
- Availability of RAW data
- No Third-Party intervention as data is safe & is on the company’s web server.
- No DNS lookups or third party calls resulting in counting the pageview at any cost.
- Not dependent on the user’s browser & records reliable data.
Cons:
- Introduction of web spiders or bots: Difficult to separate the requests from humans vs bots
- Web cache implementation: the requests were fetched from the cache resulting in no requests received by web servers.
- Web proxies & Dynamic IP assign: It was difficult to analyze the same user.
2.) Page Tagging
This method is popular & is used by most of the web analytics tools. The process is simple
- Embed the code on the website
- The data is collected on every interaction & sent to analytics servers via img tag
- The data is processed & shown in a pre-defined format as per the analytics tools.
Let’s look at some of the pros & cons of this method
Pros:
- Caching the page will not affect the data collection as in log files.
- Data can be represented via any naming convention as it is collect via JS.
- Many data points can be tracked such as transactions, revenue, visitor screen size, resolution, etc
- Events such as onclick, onhover, etc can be tracked which do not involve request to web server
Cons:
- No Data Privacy. Data will be stored on the Analytics vendor’s server
- If the user closes the browser before the code is loaded, the hit will not be sent & the interaction is not recorded.
- The pre-defined format for the data analysis via analytics UI. (Though some vendor’s might give access to the RAW data on request.)
Web Analytics Metrics That You Should Track & Monitor At Any Cost
While we saw the basics of web metrics, there are still more of them that you should track & monitor ireespctive of the web analytics tools you are using. Let’s through it one by one.
#1 Bounce Rate
Bounce Rate is already a well known metric. It is defined as
The percentage of visits that are single page visits and without any other interactions (clicks) on that page.
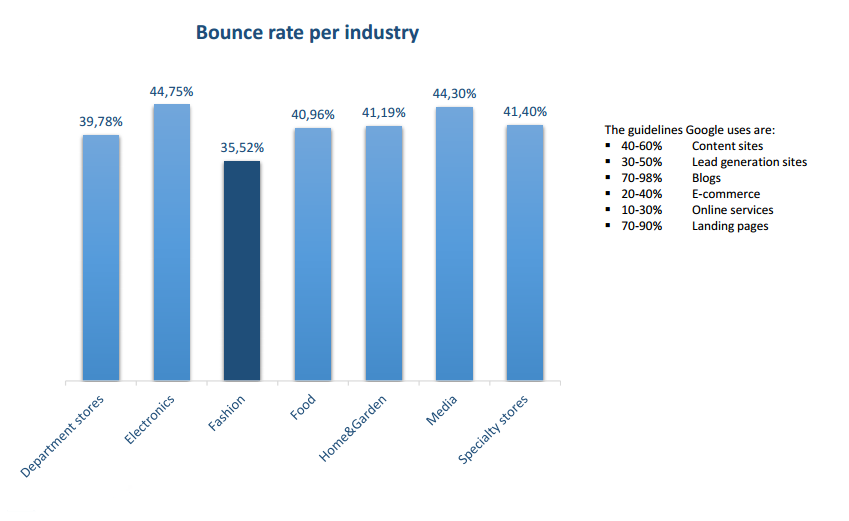
There are tons of articles on the web related to the bounce rates. Well, if you have a blog or a content site, its normal to have high bounce rates but for an ecommerce site, you should have low bounce rates.
Here’s a glimpse of the 2017 benchmark:

#2 Active Time / Engagement Time
Active Time Or Engagement Time is defined as
Average amount of time that visitors spend actually interacting with content on a web page, based on mouse moves, clicks, hovers and scrolls.
In Google Analytics, you can use
- Avg. Session Duration metric to get insights on your website engagement.
- Avg. Time on Page metric to get insights for a particular page.
Do check out google docs for more
#3 Average Page Depth / Pages Per Sessions
Avg. Page Depth is
The approximate “size” of an average visit, calculated by dividing total number of page views by total number of visits.
In Google Analytics, you’ll get these metrics as
- Page Depth
- Pages / Sessions
#4 % Exit
Exit Rate is
The percentage of visits seeing a page where that page is the final page viewed in the visit.
In Google Analytics, you’ll get these metrics as
- Exit Rate
- Exits
Exit Rate can also help you fix the leaky pages if there’s a huge drop-off. You’ll find these reports in the Behavior > All pages section.
The best way is to create a custom report filtering the funnel pages (as dimensions) & applying the exit rate as a metric. Kind of like…
| Page | Exit Rate |
|---|---|
| Product Page | 40.23% |
| Cart Page | 60.45% |
| Checkout Page | 30.48% |
#5 Conversion Rate
It is defined as
The total number of goal completions / Total number of visits.
It is a very important metric & will give you a glimpse of RELEVANCY between
- Your Website Users
- Your Website Messaging / CTA / Content
- Your Conversion Funnel
In Google Analytics, you’ll get this metric as
- Ecommerce Conversion Rate
- Goal Completion Rate
Make sure to implement ecommerce tracking to get the former metric & define the goals to get the later one.
Normally, the conversion rate metric is based on sessions rather than users. You can even re-define this metric as
Total Goal Completions / Total Users
in an excel sheet or maybe use calculated metric in GA.
Lastly...
Today the web analytics metrics list has expanded so much that there are 500+ Dimension & Metrics in Google Analytics itself.
Not all metrics are important to every department in your organization but still, it is good to know how they are defined.
Do check out these resources:
- Web Analytics Standards: 26 New Metrics by Avinash.
- Key Web Analytics Metrics by tutorialpoint.
& let me know which metrics do you monitor on daily basis.
