Last Updated on March 7, 2018 by Ritwik B
Count of Sessions is simply the nth number of session of a unique user. It is a dimension which is independent of the date range.
I first recommend you to read What are Sessions in Google Analytics.
So, If the user initiates a new session every time, the ‘count of session’ is incremented by 1.
Some of the cases where the count of sessions increments (new sessions initiated) are:
- When the user is acquired via google/cpc (COS:1) & then (s)he comes to your site via google/organic.(COS:2)
- When the user interacts with your site after the 30min timeout.
- When the user comes to your site via referral or social site.
Now, let’s us understand more about the ‘Count Of Session‘ dimension.
Where Do You See Count Of Sessions?
Experiment:
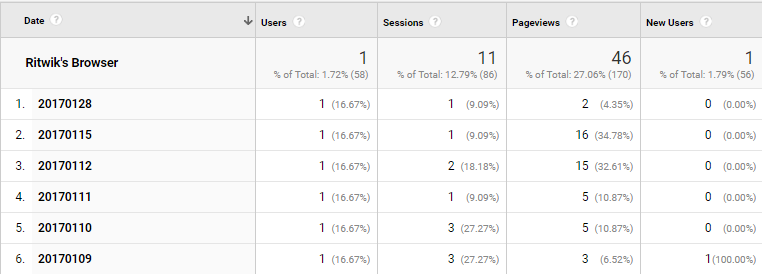
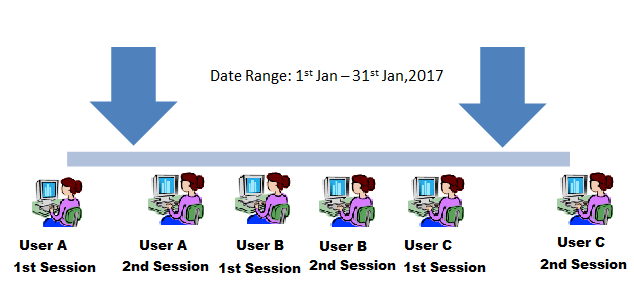
I have created a segment called Ritwik’s Browser which I always use to explain the Google analytics metrics. It’s basically my (Browser) clientId.
Date Range: 1st – 31st, Jan – 17
Observations:
- I had a total of 11 sessions for the date range (Jan – 17).
- For every session, I had a certain number of page views which are displayed in the ‘pageviews‘ column.
- ‘New Users’ is also a date independent metric & is counted when Google Analytics encounters user for the very first time. (new clientId)
- ‘Users’ are actually ‘Unique Users‘ when applied to a dimension.
If you are finding it weird to see the users not adding up to the total, I recommend you to read Google Analytics – Users – Metrics Simplified, where I have explained How Google Analytics Actually calculates users.
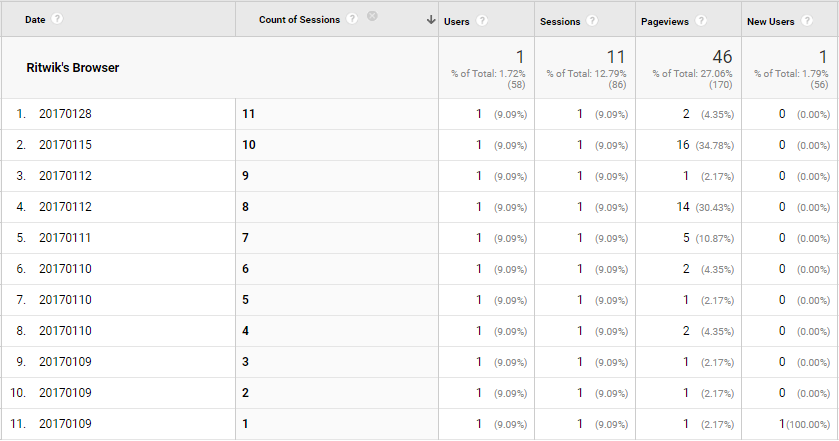
Now, let apply ‘Count Of Session’ as the secondary dimension.
Observations:
- Now everything is broken down at a session level. You can see how many pages were viewed on every session/visit.
- By creating a flat table, you can add another dimension such as
- Source: To see what was the source for every session.
- Landing Page: To see which pages they land on for every session.
- Exit Page: To see the pages where they exited for every session.
- Hour: To see what time the visit occurred.
- more…
We’ll also be looking at some of the powerful reports which you can use to analyze users later.
Count Of Sessions Default Report:
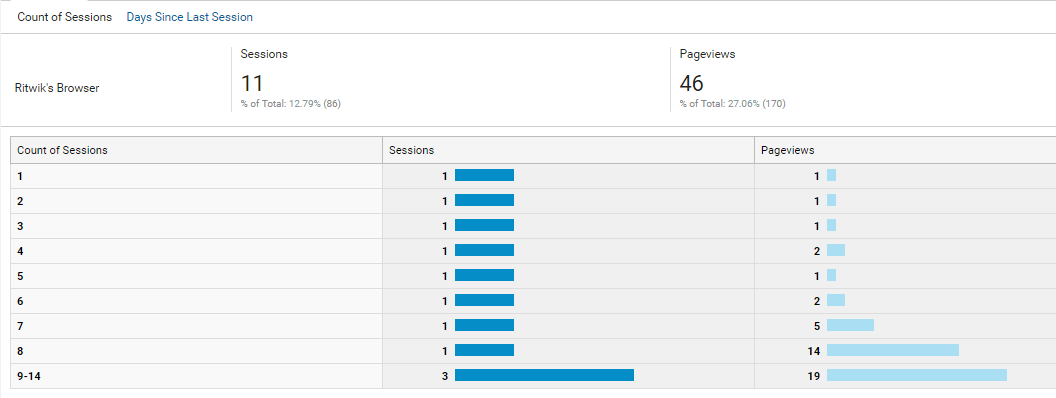
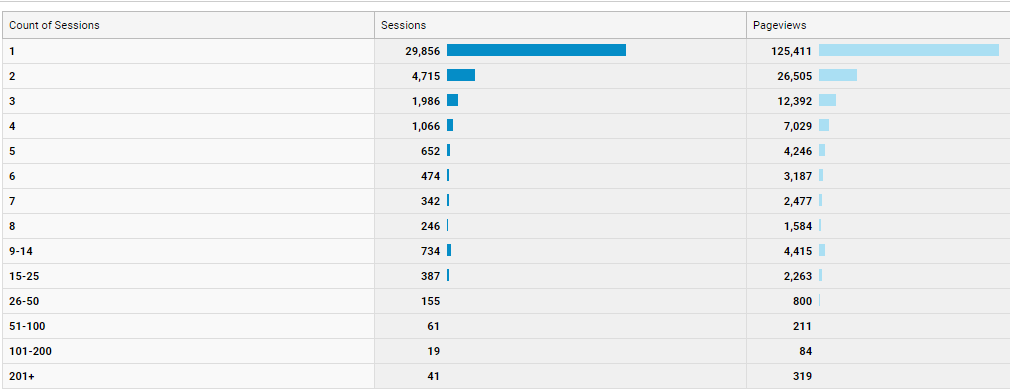
The default report for the Count Of Sessions is available at Audience > Behavior > Frequency and recency.
Date Range: 1st – 31st, Jan – 17
Observations:
- I am a single user here having 11 sessions in total (1st image) during Jan – 17.
- The sessions of a user are added once in each count bucket.
- This report is user independent, i.e you cannot predict the no. of users just by looking at this report.
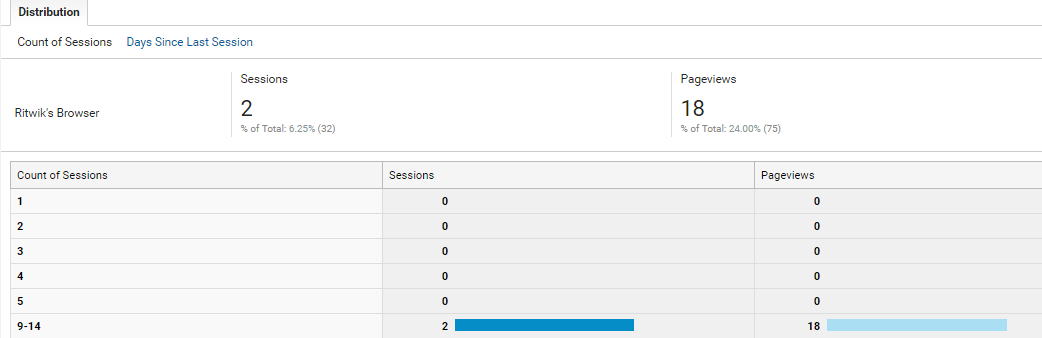
Now let’s change the date range to 15 – 31st Jan.
Date Range : 15st – 31st, Jan – 17
Observations:
- Count of sessions is independent of the date range. (i.e count of sessions will not be recounted within the date range)
- I had 2 Sessions in this date range on 15th (Count of Session:10) and on 28th (Count of Session:11) (refer 1st image).
- I get included in the bucket of 9-14 as 2 sessions.
- Here my count of sessions is retained. (and not reported in the count of session bucket 1 and 2)
Now, when you look at the overall report such as
Always remember that this is just a count of sessions of unique users during the specified date range.
So,
- There may be one or more users belonging to a particular row.
- The same users might be belonging to one or more rows.
Now, lets see what the following scenario might show.
Count of Sessions Sessions
1 2
2 2
3 0
4 0
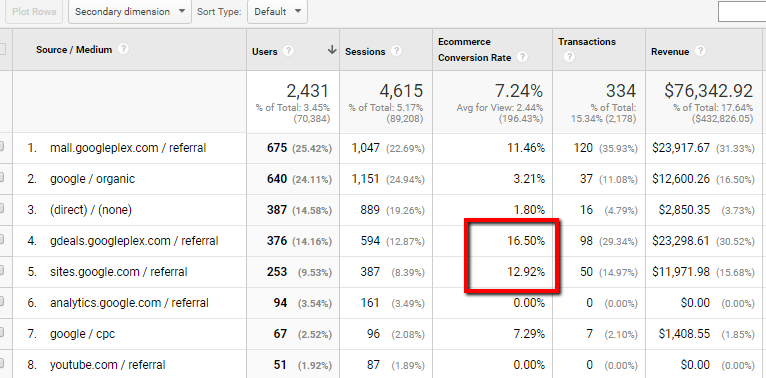
Count Of Session Analysis: Conversion Rate
This report will help you analyze the probability of user converting on a particular visit.
So, if you have an ecommerce store with high priced value items. Then, it highly likely that user will not convert at the first go, they might take several visits to purchase your item.
Let’s look at the report.
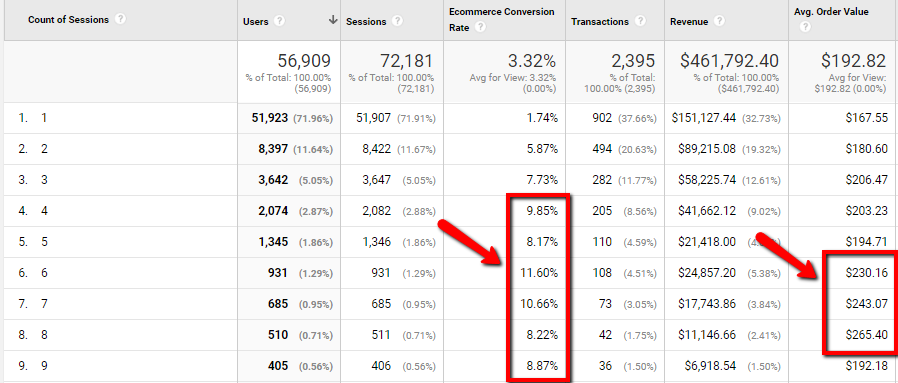
Observations:
- Ecommerce. Conversion Rate increase with every visit of the user & achieves a plateau at around 6-7 visit.
- Avg. Order Value is also greater for 6-7-8th visit.
- In fact, further segmentation for New User will give us ‘no of visit’ the first time user takes to make a purchase.
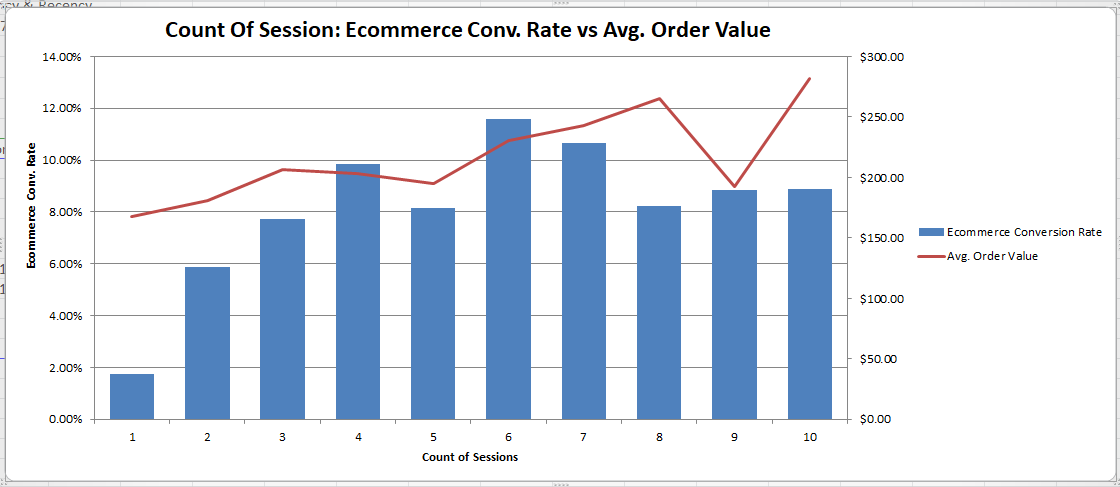
If you are a big fan of charts, you can utilize excel or sheets.
Here I have exported the data to excel & have applied a column chart.
After analyzing the Count of session for max conversion rate, you can deep dive for their sources. In short, what was the source for their 5-6-7th visit.
Here’s a custom report with the filter for the count of the session (5|6|7)
Here are some strategies you can use
- Target the sources which have more conv. rate for the 5th,6th.7th time visitor.
- Create remarketing list for the users with 5,6,7th visit & remarket them across google ad network.
- Also apply the landing pages dimension to check which page brought them to your site.
Count Of Session Analysis: Bounce Rate
You might be wondering having high bounce rates are very bad for your site. But that’s not always true…
What if the user is visiting your site for the 10th time & bounces off. That’s might not mean (s)he didn’t liked the site.
Well, you can see how many people have bounced at which visit.
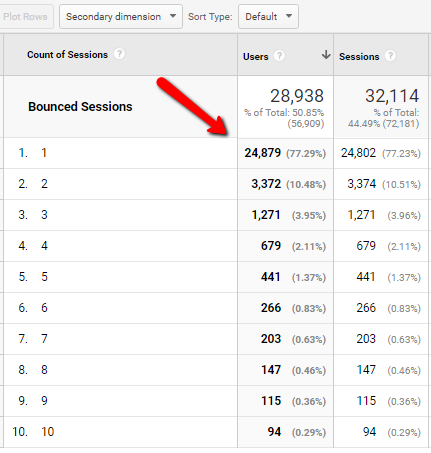
You can see that in spite of many users bounced in their very first session, there were few of them who had 1+ visits.
You can use segment the bounced user & remarket them via Google Adwords.
‘Count Of Session’ provides value only if it is used with other dimensions. Let me know in the comments if there are any session level dimension you would use for analysis….
More Articles:
Unique Pageviews vs Sessions/Visits vs Users – Metrics Simplified Series
Google Analytics – Sessions & Hits – Metrics Simplified Series.
Google Analytics – Users – Metrics Simplified Series
Google Analytics – Bounce Rate vs Exit Rate – Metrics Simplified Series
Ritwik is a product owner at DigiXport. He also loves to write technical & easy to understand blogs for Marketers & Entrepreneurs. A Firm Believer in Teaching -> Learning -> Growing. :)
how to find the session of product listing page i am unable to do
You can try creating a segment of those pages and then use count of session reports