Last Updated on May 18, 2017 by Ritwik B
Today, we’ll be focusing on this buzz keyword ‘High Bounce Rate‘. Why is this metric a nightmare for some businesses?? Is having a high bounce rate really bad?
I’ll be focusing on both sides of the coin.
Analyzing High Bounce Rates is the most important task, which will give you an idea if this metric is really worrying or not, considering your business goals.
This guide will be useful in many ways and will surely reduce your bounces. I’ll be focusing on
- What is Bounce Rate in Google Analytics?
- Is High Bounce Rate Good or Bad?
- What are Bounce Rate Industry Benchmarks?
- How to Analyse High Bounce Rates?
What is Bounce Rate in Google Analytics?
Bounce Rate is the percentage of site visits with a single page view within specified date range.
Bounce Rate = Bounces / Entrances.
It is incomplete without its dimension. Most people when they say they have high bounce rate refer to Bounce Rate of Website.
Bounce Rate of a Website (specified date range)
= Total No. Of single pageview visits (specified date range) / Total No. Of Visits to websites (specified date range).
You can also have Bounce Rate for
- Source / Medium
- Device
- Country / City
- Browser
- Page
- Custom dimension (if defined)
- and more…
The more advanced and technical definition of bounce rate is
If only a single interaction hit is sent to analytics servers with unique clientID, GA declares it as a bounced visit.
If you are unaware of clientID, I recommend you to read: Google Analytics – Users – Metrics Simplified Series
Is High Bounce Rate Good or Bad?
I have explained one of the ways to find out If High Bounce Rate is Good or Bad for you website but…
It mostly depends on your Campaign / Business Goals.
Let us say,
You running a campaign where you land users on a page (with no links) & your main goal to increase the leads.
This is the case where you could have high bounce rate and conversions too.
Now,
You are running a campaign & your main goal is to increase transactions. So to achieve your goal, you’ll have to push users through the funnel.
This is the case where you couldn’t afford to have high bounce rates.
So you get the idea…!!! The bounce rate which you see in audience overview is the combination of 1000s of such campaigns.
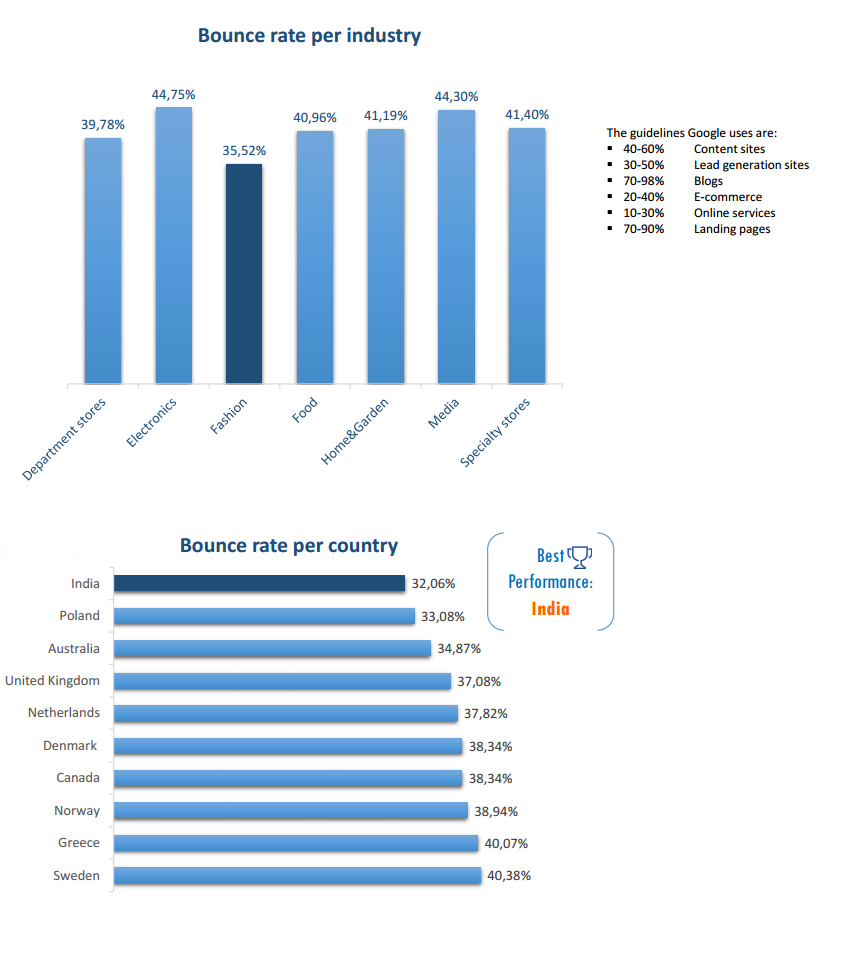
Bounce Rate 2016 Industry Benchmarks
Check out the Bounce Rate Industry benchmark 2016 by Ecommerce-Europe. Screenshot below.
How to Analyze High Bounce Rate in Google Analytics?
1.) Implement Time on Visible and Hidden Page
Google analytics does not calculate the time on the exit & bounced pages.
So, if you have high bounce rates then the metrics like ‘Avg. Session Duration’ and ‘Avg. Time On Page’ are practically useless.
Check here for more: Avg. Session Duration vs Avg. Time On Page.
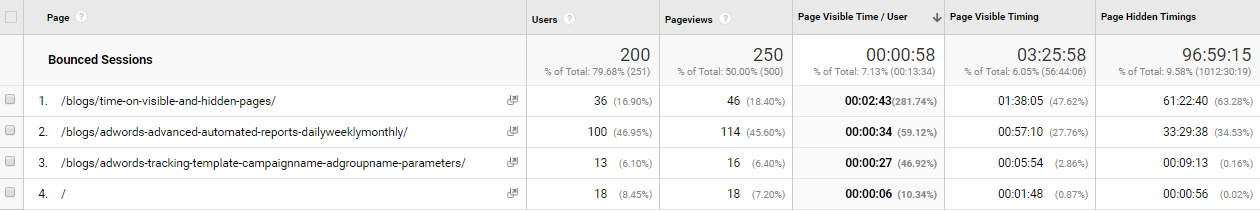
After implementing the Time on visible and hidden page, you can now view the actual time for which your page was hidden and visible to the user. (All Users)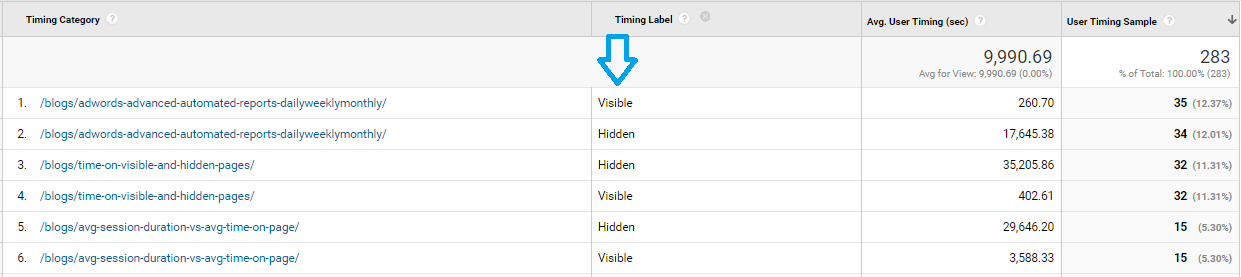
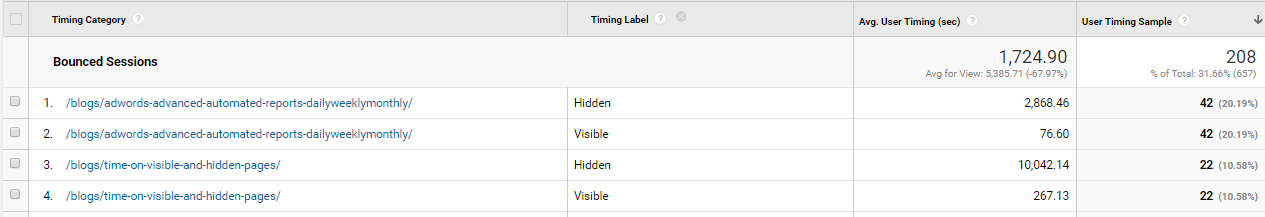
For Bounced Sessions (Segment Applied)
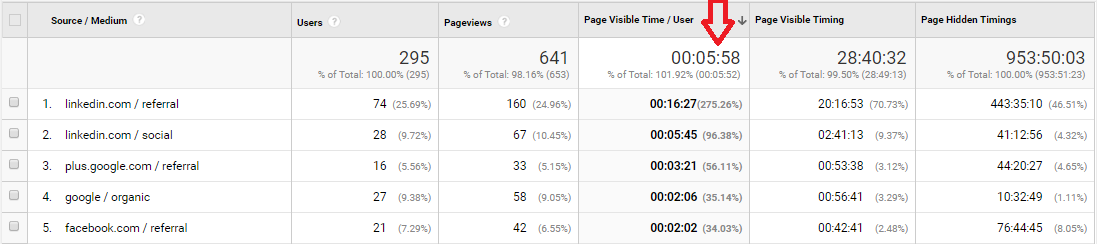
Also, You can create custom metrics ‘Page Visible Time’, ‘Page Hidden Timings’, ‘Page Visible Time / User’ and further analyze and experiment with different dimensions such as
- Page
Here I can sort by ‘Page Visible Time / User’ to get most engaging page.!!
- Source / Medium
Similar sorting would give me the most engaging source of users.
Summary
You can further create segments for analysis as per your business goals. Below are some segments you can use
- Users having Page Visible Time > X or <Y
- Users having Page Visible Time >X for more than 4 page views
- Users having Page Visible Time > X and Days since last sessions < Y
- and so on.
You can also use the following dimensions for bounced sessions segment:
- Device
- Country / City
- Browser
- Paid / Non – Paid Channels
- Branded / Non-Branded keywords channel
- Custom Dimensions (if applied)
- etc
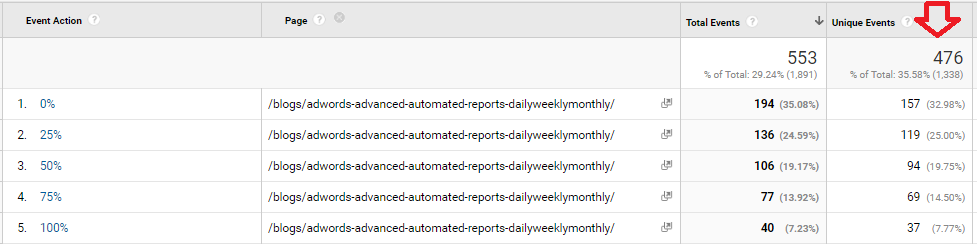
2.) Implement Scroll Tracking on Pages
The thing I like about this script that it focuses on the main goal. i.e Content Consumption. It will give the % scroll of your web page.
So, if you have a lead form above the fold and the content below, you can clearly segment the converted users to see if they are actually consuming the content.
Take a look at some of the dashboard: (All Users)
![]()
For Bounced Sessions: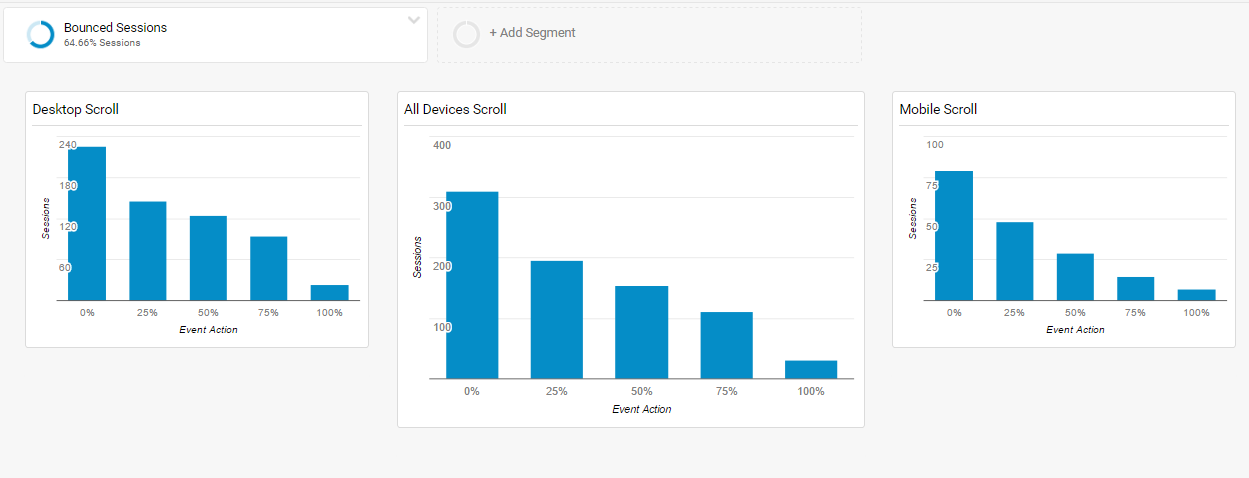
You can also filter the page having high bounce rate and check for the drop offs.
Summary
You can try to
- Segment the users who have 100% scroll for more than 3-4 page view. (Loyal readers)
- Segment the users who have 0-25% Scroll and only 1 pageview.
- Segment the users who have 100% and 3-4 min Time On Visible Page. (by combining the above 2 scripts)
Also, try using these segments to gather more insights:
- Device
- Pages (Do check page with high bounce rate)
- Browsers (If users are able to scroll on all browsers)
Also, don’t forget to re-market these segments on google and other ad networks.
3.) Analyze ‘Bounced Users’ instead of ‘Bounced Session’.
These segments will let you know if Bounce Rate is Good or Bad for your business
There might a scenario where some users already had converted or engaged on your site, but still, they land on your page and bounce because
- You show them some ad or offer, but they just land on the site, check and leave. (maybe planning to convert later)
- They might land on your page but as its a too long read. They plan to read it later, etc
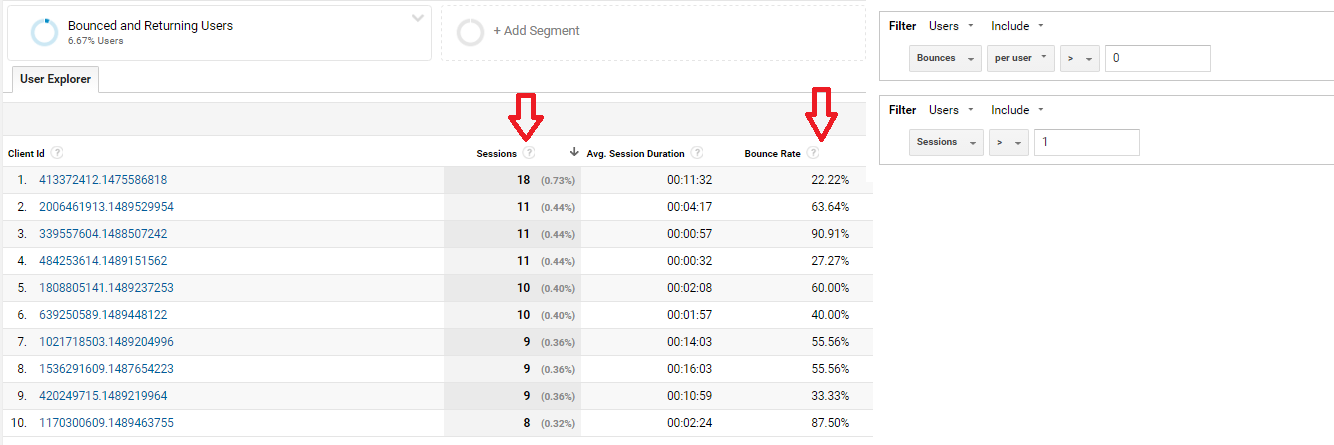
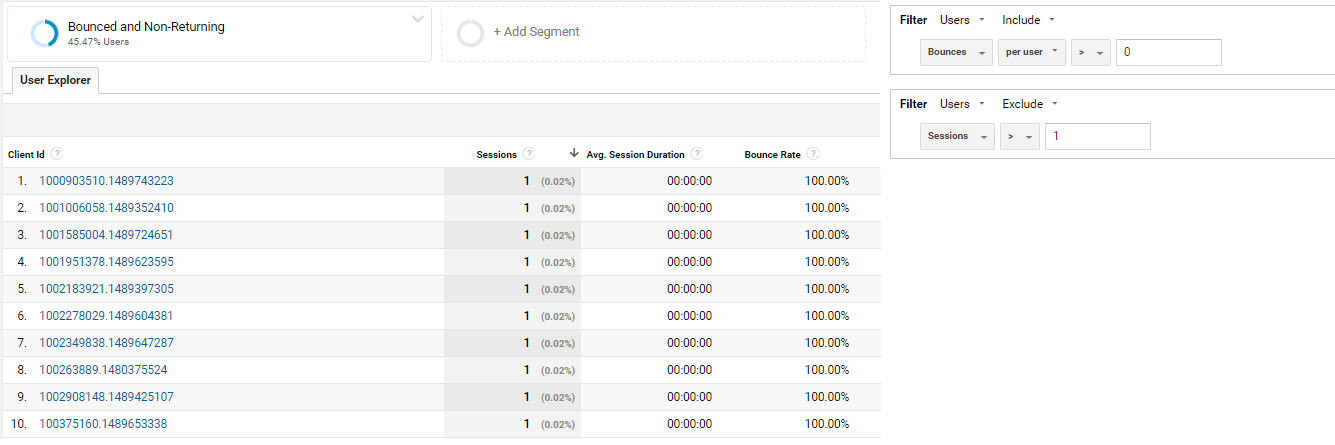
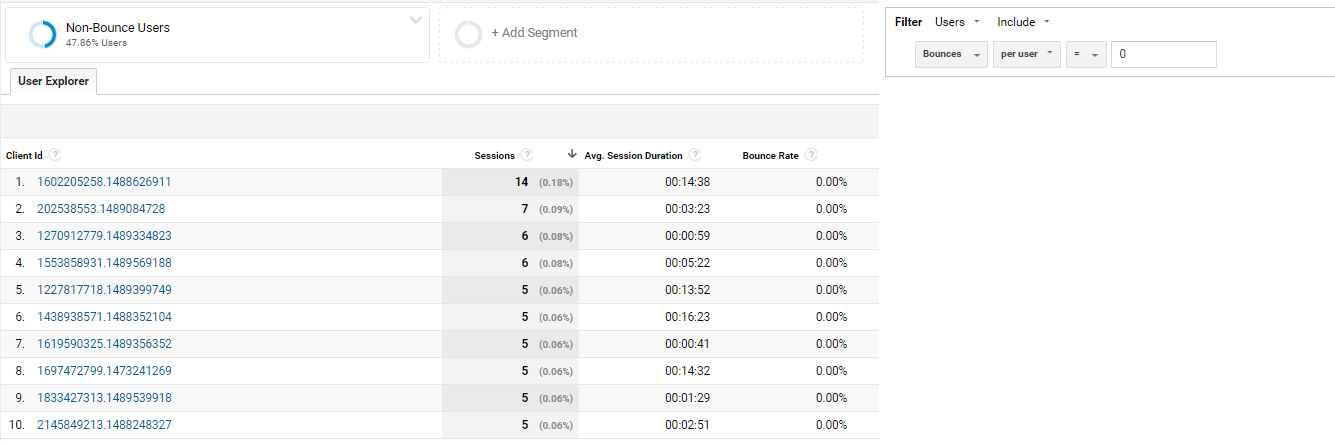
There are 3 types of users on your website:
- Bounced and Returning Users – Users who had bounced at least once in their total visits.
- Bounced and Non-Returning Users – Users who had a single bounced visit and never returned. (Most worrying!!)
- Non-Bounced Users – Users who have never bounced at all. (Best Category of Users!!)
All Users = Bounced and Returning Users + Bounced and Non-Returning Users + Non-Bounced Users.
Let take a look at source / medium report:
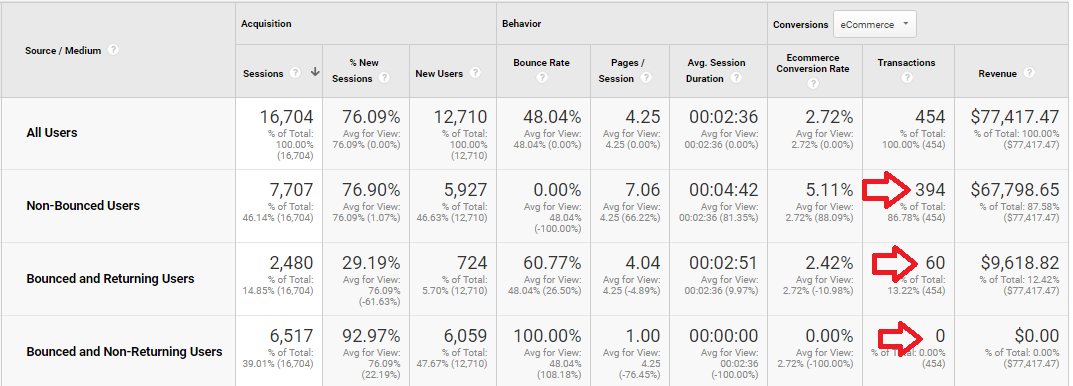
Observations
- Non-Bounced Users contribute to 87.5% of the total revenue. Also, they have more transactions, Ecomm. conv rate and revenue.
- Bounced and Returning Users still contribute 12.4% of total revenue.
- While Bounced and Non-Returning Users are the worst performers!!
In this scenario,
Having high bounce rate is bad & you should try to move the users from ‘Bounced and Non-Returning’ to ‘Bounced and Returning’ bucket.
Next, you can check the Landing Pages or Page groups which were viewed by your first and last visitors. (Bounced and Non-Returning Users)
Also, You can use these segments to re-market with different ad copies.
Summary
- To decide if the bounced visits are good or bad, try to analyze the Conversions, Revenue, Conv. Rate, ROI for these 3 segments.
- In E-commerce sites, it’s normal that Non-Bounced Users have more Transactions, Revenue, and Ecommerce Conversion Rate.
- If you are in B2B, this might not always be the case and you’ll end up in the complete different scenario.
(Maybe having Conversion or Revenue in Bounced segments > Non-Bounced Segments) - Use The Bounced & Non-Returning Segment across all the Dimensions to analyze the weak points in Acquisition, Behavior, and Conversions. Some dimensions you can try are:
- Landing Page
- Device
- Country / City
- Browser
4.) Analyze Demographics
This is a follow-up of the ‘Bounced Users’ segment implemented in #3. Check if your target audience is correct.
You compare the demographics of the ‘Converted Users’ vs the ‘Bounced and Non-Returning’ Users.
Apply these segments
Converted Users – Users who have completed all goals and transactions.
Bounced & Non-Returning Users – Users who bounced in their single visit and never visited your site again.
Go To the Demographics Report. Check here if you have not enabled the demographics reports in analytics.
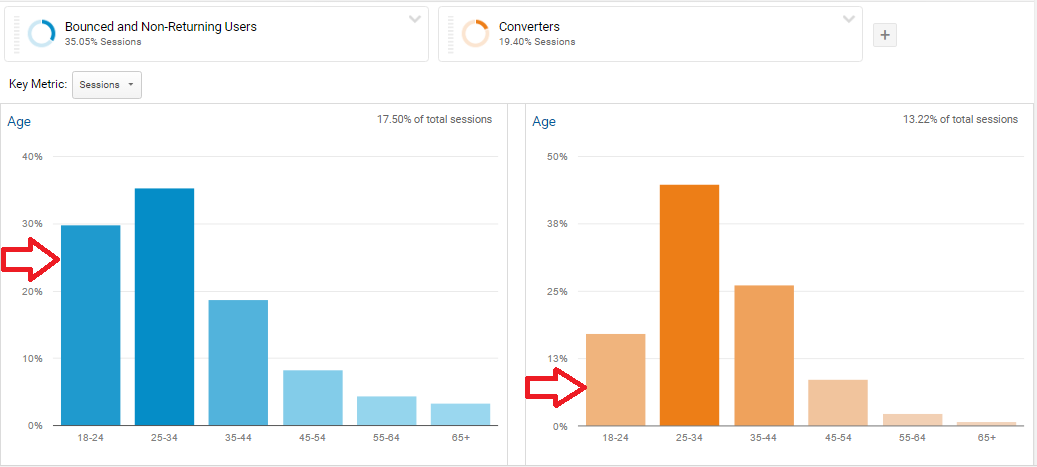
Observations
- You can see the users in the age group 18-24 has more bounced and non-returning users as compared to converted users in the same category.
- You can refine your target to focus on 25-34 users group.
Next, you can also check for Gender, Affinity, In-market audiences and compare these segments.
Summary
- Analyze the Demographics of Converted and Bounced Users
- Find the source of this traffic and refine your targeting.
- Repeat the same for Interests report.
5.) Adwords Search Query, Ad Copy, and Landing Page Relevancy Analysis
If you are running Adwords campaigns and if analytics and Adwords are well integrated, you’ll get Adwords data in analytics.
Here, you can create this awesome custom reports to see 2 things
- Search Query & Ad copy relevancy
- Search Query , Ad Copy & Landing Page relevancy.
You can also use this report to anlayze the Quality Score for adwords keywords.
(Click below image to Enlarge)
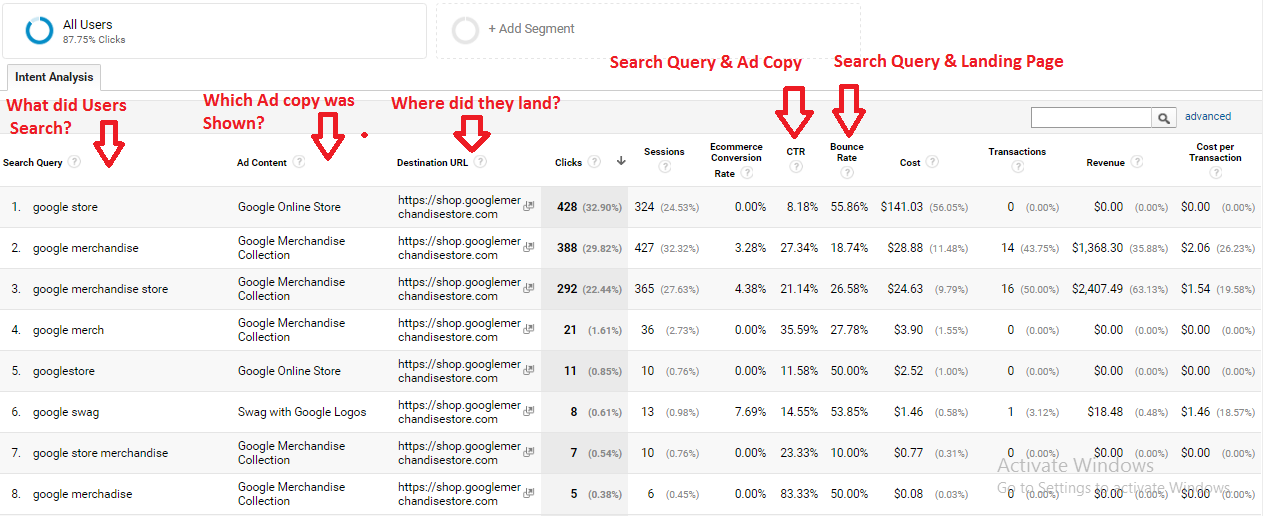
Observation
- You can sort this report by cost or clicks to know if the bulk traffic which you spend the most has been targeted correctly.
- Here, check these metric for relevance
- CTR – Search Query & Ad Content Relevancy
- Bounce Rate – Search Query & Landing Page relevancy
- The search query ‘Google Store’ has high cost, high bounce rate and fewer transactions than
the search query ‘Google Merchandise’ with the same landing page.
Find these converting keywords, ad copies and landing pages trio, then you are good to go.
Summary
- You can use this report to analyze Bounce Rate of your site and also Quality Score of your keywords in adwords.
- As cost is involved in paid campaigns, check if the content is consumed by tracking %scroll and time on page for bounced sessions.
- You can apply Campaign, Ad groups or Keyword as a dimension to know the trigger for the search query.
- You can focus more budget on these 3 relevant trios. (Search Query, Ad copy & Landing Page)
6.) Use Analytics Comparison Reports
You can use the comparison reports in google analytics.(Check top right corner of image below)
Always use the advanced filter to filter out a particular page group and then analyze the bounce rate for the pages in that group.
For Eg: I have filtered ‘google+redesign/apparel’ page group.
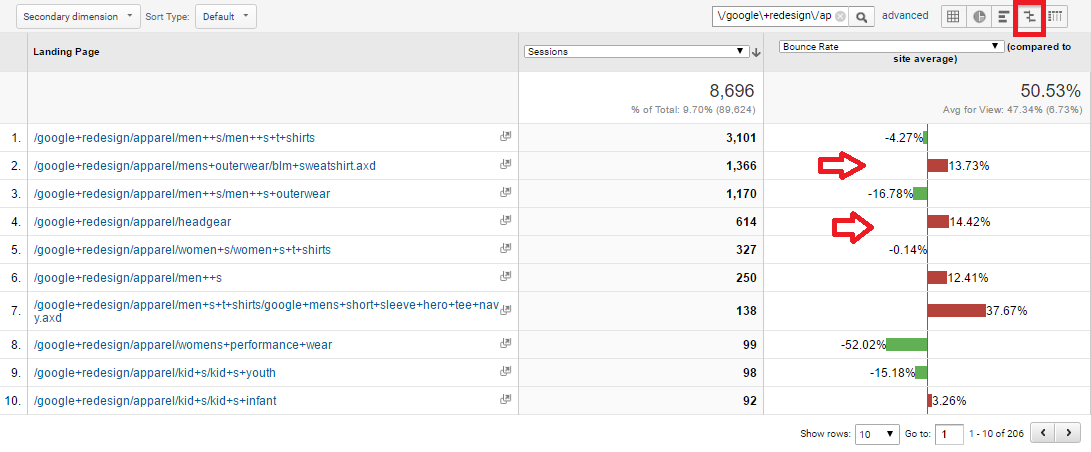
Observation
- The Bounce Rate for the filtered group is 50.53%.
- The Bounce Rate for particular pages are X% high or low than 50.53% (X is corresponding increase/decrease in bounce rate)
- The bounce rate of 1st-row page is -4.27% less than 50.53. i.e 50.53(100-4.27)= 48.38%
- and so on.
Summary
- Always use this report by applying filters.
- You can also use content grouping to group particular pages.
- Always focus on pages with high bounce rates & high entrances.
- Analyze the same report with different dimensions such as
- Source / Medium
- Device
- Browser
- Country / City
7.) Site Speed Analysis
Go To Behavior > Site Speed > Page Timings Report.
Here you can apply device as a secondary dimension.

Observation
- Check for any correlation between Avg. Page Load time and Bounce Rate for all devices.
- Check by applying secondary dimension as the browser to check for any browser issue.
You can also use third party tools for site speed test such as
8.) Implement Accelerated Mobile Pages (AMP)
The Accelerated Mobile Pages is an open source initiative that aims to provide mobile-optimized content with less page load time.
According to Google,
Avg. Page Load time for non-AMPs is 22 sec, while for AMP is 0.7 sec.
Bounce Rates can cost you big if you have a large website. According to kissmetrics, 1 sec delay in page load can decrease you conversion by 7%.
Take a look at the Stats by Kissmetrics. 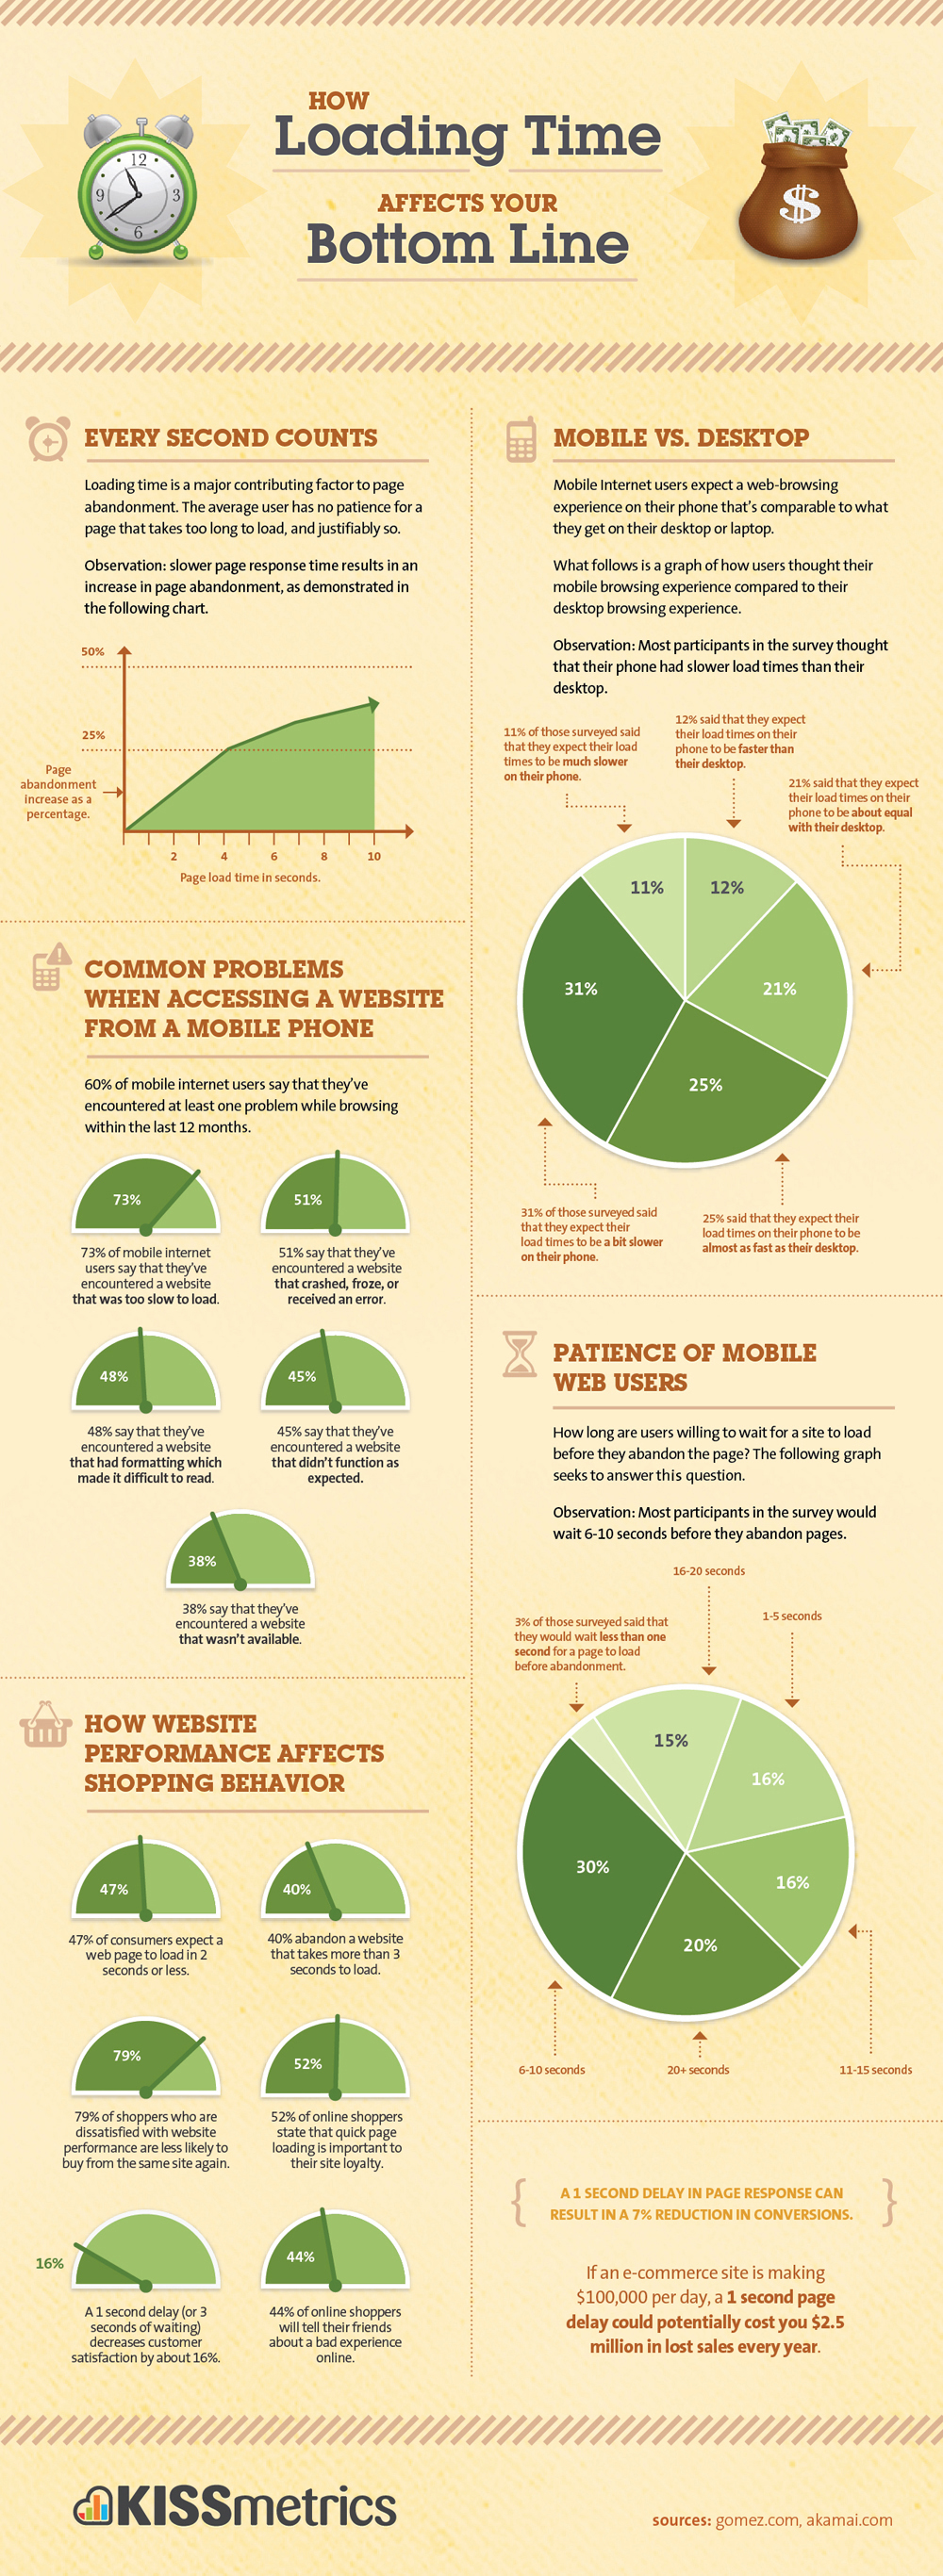
Google has already indexed AMP pages of more than 640,000 domains.
Most of the websites using AMPs are news sites and blogging websites. If you have a content website, it is must to have AMPs.
You can check AMP Project for official docs.
9.) Implement Visitor Recordings & Heatmaps
You can use tools to analyze visitor recording and heat maps to see if users are facing any problems on the landing page.
Some of the problems might be
- Confusing lead forms.
- Form buttons not working properly.
- Some links not clickable.
- Some website features not working in other browsers or devices.
- and more
You can use tools like
10.) Implement Polls & Surveys
You can conduct Polls and surveys on high bounced pages to check if users are facing any problems.
Make your surveys easy and simple to be answered by users. You can ask
- Kindly rate us from 1 – 5
- Did you find what you were looking for?
- How did you find our site?
- Was this information helpful?
- Is the pricing too high?
- and so on
You can find lots of questions from the sites providing these services
You can use the same tools above
Summary
The analysis would be much more powerful if you implement the combination of techniques discussed above.
Try to focus on the main goal of the campaign/business. Be it
- Content consumption,
- Increase leads/transactions/video views
- and so on.
Always start with the analysis and then decide if you should be focusing on bounce rate.
Ritwik is a product owner at DigiXport. He also loves to write technical & easy to understand blogs for Marketers & Entrepreneurs. A Firm Believer in Teaching -> Learning -> Growing. :)
Great post. that will help to educate my clients on why a high bounce doesn’t really mean a bad thing 😉
Thanks @disqus_2Zi42Oeql9:disqus . Yes, Right..!!!!