Advanced Guide To Cohort Analysis in Google Analytics

Cohort Analysis Startups Banner

Cohort Analysis is one of the powerful methods to analyze different buckets of user.

It will answer some the important questions like:

  • What were the revenues from the Display Campaigns that we ran which had high bounce rates?
  • How many days/weeks/months does users take to convert on high priced products? 
  • How many desktop users vs mobile users are retained over time after acquisition?
  • Which bucket of users should I remarket & when should I do it?
  • Which products users buy after acquisition & how soon do they buy it?


First, let us understand the definition.

What Does Cohort Mean?

The cohort is defined as the users having common characteristics in a specified date range.

In Analytics, common characteristics mean ‘common dimensions & metrics conditions’.

Lets look at some of the cohorts you can define.

So, these are the users having
(Dimensions only)

  • First Session Date = 2/4/17
  • Acquisition City = London
  • Acquisition  Browser = Chrome
  • Acquisition  Source / Medium = google / cpc
  • Acquisition Device = Desktop
  • & so on.

(Dimensions & Metrics)

  • Revenue > 200$ in Last 30 days
  • Add To Carts > 500$ & Transaction = 0 & Date Range: Last 30 Days.
  • Transactions > 1 & Session < 3 & Date Range: Last Month
  • & so on.


You can see these various cohorts are created by using dimensions or metrics condition.

Cohort analysis is analyzing those cohorts to get better insights about users.

So, the workaround to create any cohort would be to use Custom Segments or Google Analytics API.

Understanding Cohort Analysis Report in Google Analytics

Cohort Analysis report is available in Audience > Cohort Analysis.

Cohort-Analysis Report - Digishuffle

Report Settings

Lets understand the report settings

Cohort Type

There is only one cohort type which is Acquisition Date. The dimension is also known as ‘Date of First Session’ in analytics.

Cohort Size 

Cohort Size is the time period by which you want to group the New (Cohort Type) Users.

You can split the Cohort by 

  • Day – New users in a day
  • Week – New users in a week
  • Month – New users in a month

Date Range 

It is the no. of day/week/month data displayed for cohorts.

The Date Range is dependent on the Cohort size selection.

  • Day (30 days max. Lookback Date Range)
  • Week  (12 weeks max. Lookback Range)
  • Month  (3 months max. Lookback Range)

Metric

The metrics available are perUser, Rentention & Total metrics.

perUser metrics are

  • Revenue per User
  • Transaction per User
  • Goal Completion per User.
  • etc

Retention metrics are

  • User Retention

Total metrics are

  • Users
  • Revenue
  • Transactions
  • Goal Completions
  • etc

Graph Settings

Cohort-Analysis-GraphProperties - Digishuffle

In Graph Settings, you can see the drop down where you can select the cohort check boxes.

Here, you can select individual  date range cohort along with the others.

Only 4 cohort options can be selected at a time.

You can analzye & compare cohorts with different Date Range.

You can select different metrics or Cohort size to compare different cohorts in the graph.

Cohort Rows

Let us understand cohort rows.

Cohort-UserRetention-google-analytics-digishuffle

The Day 0 in the Jun 8, 2017 row represents the Jun 8.
Day 1 is Jun 9,
Day 2 is Jun 10
& so on..


Metric : User Retention

You can see the Users on Jun 8 were 1760 which are Day 0 Users.

So Day 1 represents How many of the Day 0 users (1760) returned the next day. 

Similarly, Day 2 represents How many of the Day 0 users (1760) returned on 2nd day.
& so on..

A similar setup can be done in custom reports. Follow these steps:

  • Create a custom report with dimension=Date & metric=Users.
  • Apply the segment & use the condition as ‘Date of First Session’. 
Segment - Analytics Cohort Report - Digishuffle
Custom Report vs Cohort Analysis Google Analytics - Digishuffle

The numbers in the custom reports will nearly match the cohort analysis report users.


Metric : Revenue Per User

Here,

Day 0 will represent How much was Revenue per user on the acquisition day of the user. 
Revenue per user = Revenue (Day 0) / Users (Day 0)

Day 1 represents,
The revenue of the Day 0 users the next day / Users (Day 0) 

Similarly, Day 2 represents,
The revenue of the Day 0 users on the 2nd day / Users (Day 0) 

& so on..

A similar setup can be done in custom reports. Follow these steps:

  • Create a custom report with dimension=Date & metric=Revenue.
  • Apply the segment & use the condition as ‘Date of First Session’. 
Cohort - Revenue per User - Digishuffle

You can also check other metrics available in cohort analysis report.

Cohort Analysis for Ecommerce

For Ecommerce, you can use metrics like

  • Revenue Per User
  • Transaction Per User
  • Goal Completion Per User
  • Revenue

Let us start with the graph

You can see trend of the Revenue Per User & its decline week on week.

Here, you can strategize your remarketing & new user acquisition plan based on attrition.

Segmenting this report would give you more detailed view of the cohort.

Cohort Analysis - Segment by Device

Desktop & Mobile Users Cohort Analysis Reports - Digishuffle
  • Desktop & Tablet Users have better return rate as compared to mobile users.
  • You can now focus on
    • Improving the performance of mobile users
    • Acquiring more relevant traffic from Desktop & Tablet.

The most important thing is your first impression of your mobile website to the new users.

As per Gomez,

88% of online consumers are less likely to return to a site after a bad experience

So, its important to focus on UI/UX. You can also try segmenting by

  • Browser
  • OS
  • Screen Resolution

Cohort Analysis - Segment by Products

Cohort Analysis - Table Data - Digishuffle

Another strategy is to segment by products.

  • You can see Product A & Product B has good response in the acquisition month as compared to Product C.
  • These users continue to drive revenue in 2 consecutive months for Products A & B.
  • You can compare at most 4 segments at one time. You can try it for most sold products. Cause 80% revenue is driven by your 20% products.
  • Also try using the metric Revenue Per User for better view.

Cohort Analysis - Segment by Traffic Source

You can also segment the report by different traffic channels.

  • You can analyze the traffic with long term gains & thn focus your marketing budgets accordingly.
  • You can plan to remarket or acquire new users based on the on the traffic channels attrition.

Cohort Analysis for Lead Based Websites

Cohort Analysis - Event Segments - Digishuffle

There is only one goal metric which is Total Goal Completion. There is no single goal completion metric.

Here..

  • You can segment the users based on the events & use User retention metric to see their performance.
  • You can also use other engagement metrics like
    • Session duration per user
    • Pageviews per User
    • Session Duration

Summary

  • Always segment your cohort analysis report to get better insights.
  • Large data might cause sampling issues.
  • Use User ID view for better data across cross devices.
  • To get more detailed insights use Google Analytics API or other tools such as mixpanel, kissmetrics,etc 
    (Mixpanel Cohort Reports Screenshot). Try Mixpanel as it is a freemium tool.
Mixpanel - Cohort Analysis Report - Digishuffle

Ritwik is a Web Analyst & Product Marketer. He loves to write technical & easy to understand blogs for Marketers & Entrepreneurs. Focused on Google Analytics, Facebook Analytics, Tag Management, Marketing & Automation Scripts & more. Google Certified Professional. A Firm Believer in Teaching -> Learning -> Growing. :)

Comments (7)

    1. Thanks Janvi.!!

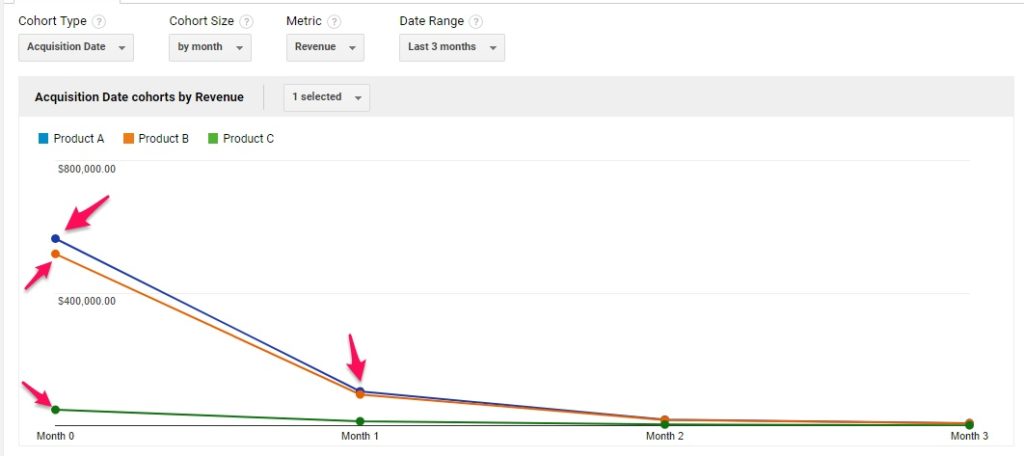
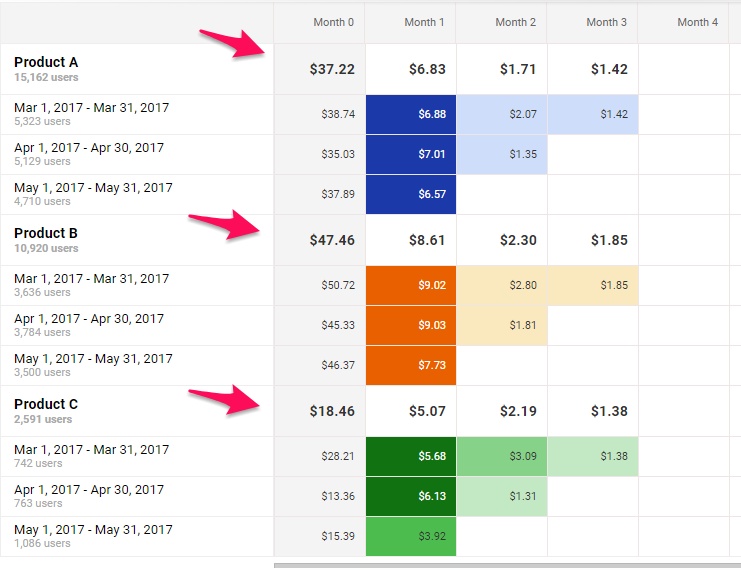
  1. Thanks for the post. I had a question. In your article you said “You can see Product A & Product B has good response in the acquisition month as compared to Product C.”

    As a marketer how can I act on this insight?

    Rishi

    1. Hey Rishi,
      Great Question!! You can do 2 things
      1.) Analyze The Problems & Find Ways To Improve. &
      2.) Promote What’s Already Working

      Well, always look for multiple data points to arrive at a conclusion/strategy.

      Analyze Why “Product A & B has more revenue per User than C”
      – Is Product C more costly & less transacted than A & B? (Do they belong to same category?)
      – If Not, Is Product C less promoted than A & B. Do they have same user acquisition source?
      – Do user’s have bad experience after using Product C ? Why they don’t do multiple purchases ?

      Better way is to analyze the Product C purchased users segment.
      1.) By asking for feedback through email / call.
      2.) View Their Live Recordings using Fullstory or Hotjar.
      3.) Offering some goodies/discount.
      etc..

      Thanks,
      Ritwik

      1. Thanks, Ritwik. I have a followup question. You said “If Not, Is Product C less promoted than A & B. Do they have same user acquisition source?” could the promotion or acquisition source for product C impact repeat purchase rates of product C? I’m curious …

        1. Hi Rishi,

          In the blog example, Product C purchased users are less as compared to Product A & B. (assume same prices)

          So, Product A & B pages have more traffic acquired via
          – Search Campaigns with relevant keywords or maybe brand keywords. ( Relevant Acquisition Source & more return rate)
          leading to more conv. rate & more revenue/user.

          While product C page has very few users acquired via
          – Generic organic keywords Or Display Campaigns (Less Relevant Acquisition Source & less return rate)
          leading to less Conv. Rate & Less Revenue/User.

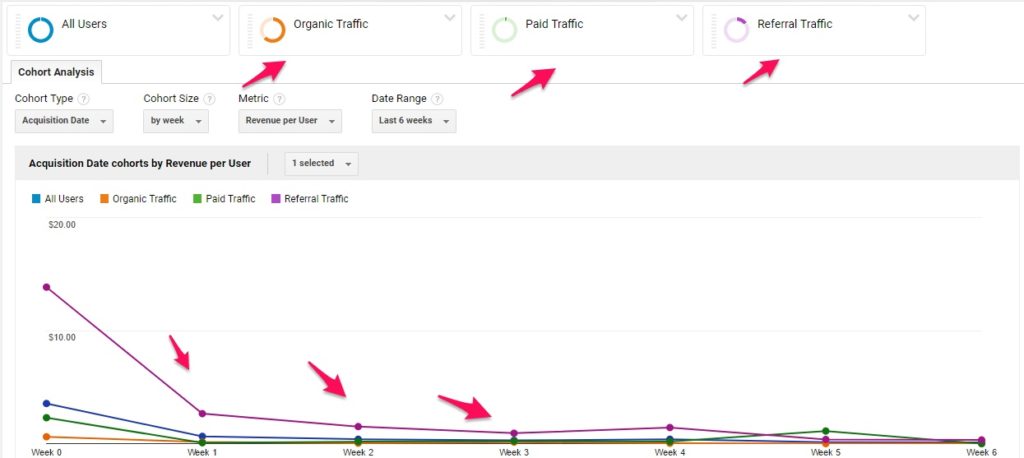
          To figure out relevant source, you can segment the acquisition source & look if that cohort drives revenue MoM.
          Or there is a ready-made report in Audience —> Lifetime Value.

          Thanks

          1. Thanks for the explanation.

Leave a Reply

Your email address will not be published. Required fields are marked *