Last Updated on February 22, 2018 by Ritwik B
One of the most important parts of your business is to know where your prospects are, but if you are starting Adwords for the very first time or if you do not have your industry specific city data, there are two strategies you can adopt:
- If your target audience is in a particular country, then you can start by targeting the whole country and then after some weeks exclude the underperforming regions and optimize only performing regions based on their respective performance.
- Start by targeting metro cities, or Tier – 1 cities. Then slowly expand the inventory, by adding new cities based on the performance of the previous cities.
For eg: If your budget is Rs.5000 daily (Indian Currency). You can create separate campaigns for say 5 cities Rs.1000 each. If some cities are under performing, pause them and add the same no. of new cities. So that, your budget will not be overspent.
Strategy – 2 can be adopted if you are having budget constraints.
Personally, I prefer strategy – 1, because if you target the whole country at the start, you will get valuable data of most cities sooner such as impressions/demand from a particular city, etc. This will help in planning and budgeting for the particular cities in the future.
Now, what usually happens is while you have adopted strategy – 1, AdWords tends to target cities based on your target settings in AdWords. So there might be some cities which incur costs but have very few or zero conversions.
It would be better if you monitor those cities or else the overall CPA will go up.
Wouldn’t it be great if you could measure the impact on CPA if you plan to pause these underperforming cities?
and also automate this setup?
So here are the steps to do so
Adwords City Optimizer – Underperforming vs Performing Cities
If you are new to AdWords scripts, do check How To Run The Adwords Scripts
Step 1
- Get the script from Adwords City Optimizer Script
- Paste & Authorize the script in Script Editor.
Step 2
- Preview the script.
- Open the spreadsheet URL in the Logs.
Here’s what you’ll get:
So, when you run the script for the first time, you’ll get the data for last 7 days by default. If you want to select a custom date range, you can input it in the top cell (B2-C2) and re-run the script.
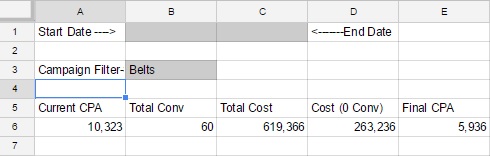
Understand City Optimizer Spreadsheet
- Campaign Filter: You can filter data by campaigns. If left blank, data for all the campaigns will be shown. For eg: if you type ‘shoes’, the data will be shown for all the campaigns containing ‘shoes’.
- Current CPA: The cost per acquisition for selected date range and all the campaigns (if filter not applied).
- Total Conv: The total conversions for the selected date range and campaign filter.
- Total Cost: The total cost incurred by all the campaigns (If filter not applied).
- Cost (Zero Conv): The total cost incurred by all the cities having zero conversions.
- Final CPA: This is the CPA you’ll get when you exclude all the cities having zero conversions. It is given by (Total cost – Cost (Zero Conv)) / Total Conv.
Use Case:
Suppose,
- I have an e-commerce store, where there are many products.
- I have created different campaigns for each product targeting whole country i.e Shoes, T-shirts, Belts, Jeans, etc.
- My belts campaigns are giving me much higher CPA. So I’ll input ‘Belts’ in campaign filter. After that, I can see my current CPA for Belts campaign to be Rs.10,323, also if I pause the cities having zero conversions, I can get the Final CPA to Rs.5936!!.
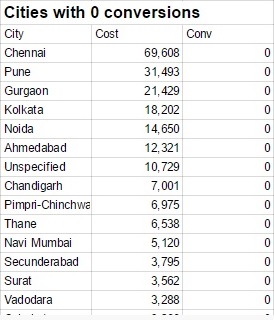
So, which are those cities eating my money?
- You can find those cities in the last table named Cities with 0(Zero) conversions.
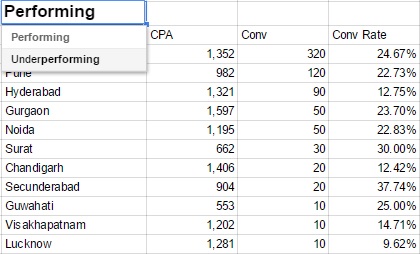
- You can also check the performing and underperforming cities in the table. You’ll get a drop-down for Underperforming and Performing cities.
Performing vs Under Performing Cities
Now for everyone, the definition for performing and underperforming is relative.
Here, I have taken underperforming cities as those cities whose CPA > Current CPA.
So, if any city having CPA more than average is underperforming and cities having CPA < Current CPA are performing.
It is not always likely that underperforming cities are bad or should be paused, they might have high CPA or low conversion rate but also have more conversions. So depending on the business goals, decisions can be made.
City Trends Sheet – Campaign Filter
- In the next sheet ‘City – Trends’ you’ll get day wise performance of the cities.
- You can also filter the data by campaigns and use the drop down for a particular city. So, I can see the day wise performance for my Belts campaigns in New Delhi city.

- Also, you can refer the graph for visuals.

The best thing would be to take a longer date range & see the conversion rates of various cities and how they vary.
The CPA, which is one of the major concern of the majority of the businesses can be optimized by analyzing the cities.
Well, this is just one of the factors affecting CPA.
Automate City Optimizer Script
- The data you get when you run the script for the first time is of last 7 days. You can now enter the Start Date and End Date as dynamic value
- Eg: Start Date: Today()-7
End Date: Today() - Schedule the script to run daily & you’ll get last 7 days data every day!!!!
You can experiment with the start & end dates to get various different scenarios.
Happy analyzing folks.!!
Check out:
Adwords Advanced Automated Reports
Adwords Tracking Template – {CampaignName} & {AdGroupName} Parameters
Ritwik is a Web Analyst & Product Marketer. He loves to write technical & easy to understand blogs for Marketers & Entrepreneurs. Focused on Google Analytics, Facebook Analytics, Tag Management, Marketing & Automation Scripts & more. Google Certified Professional. A Firm Believer in Teaching -> Learning -> Growing. :)