Index
How To Use?
DigiXport is a simple tool having 2 main features
- Facebook & Bing Ads Export in Spreadsheet.
- Google Analytics Data Upload.
You can also use this tool for
- Spreadsheet/Excel Reporting
- Data Studio Reporting
- Uploading Data To Google Analytics.
You can save the query which will generate the query ID, that can be used for scheduling data export. So, that you don’t have to manually fill in all the options.
Using the spreadsheet functions will unlock more powerful features which we will be looking at soon.
Also, don’t forget to take a look at the resources links at the bottom of the article.
Let’s begin…
1.) Facebook & Bing Ads Authorization
Get started by clicking on “+Add Account“. Complete the authorization process. Currently, we only support ‘Facebook‘ & ‘Bing‘ connectors.
Click Here To know the Authorization Process.
Once you are authorized, you can start exporting data for those accounts. If you want to modify the exported data, you can use the spreadsheet functions.
Note:
- Some field combinations are not compatible & you’ll receive the respective error.
- Only Single User (email) can be authorized for Facebook & Bing (separately).
2.) Spreadsheet QUERY Function
You can do much more with exported data if you utilize the QUERY function in the spreadsheet.
QUERY function utilizes the ‘Google Visualization API Query Language‘ which is similar to SQL language.
The language is quite easy to understand even if you are a newbie & never been into technical stuff.
It has the following format
=QUERY([DATA RANGE],[QUERY],[HEADER ROWS])
DATA RANGE:
- Select the data range from the spreadsheet. For Eg:
- A2:G5 selects the data from cell A2 To G5.
- ‘Sheet2’!A2:G5 selects data from Sheet2’s cell A2:G5
QUERY:
- This represents the Query to be used for the selected data range. For Eg:
- “Select *” denotes select all columns & rows
- “Select A,B,C” denoted selecting columns A,B & C from the selected data range.
- While there are complex queries involved, we’ll go through some basics first. You can check the whole list of Query formats here.
HEADER ROWS:
- It simply denotes the number of header rows in the selected date range.
- You can input 1, in case of a single header row. You can even enter -1, so that, google will decide the number of header rows automatically.
Let’s look at a simple use case.
1.) Create a ‘RAW Data’ sheet
- Simply create a new sheet, name it ‘RAW Data’
- Export the data on that sheet on cell 1,1.
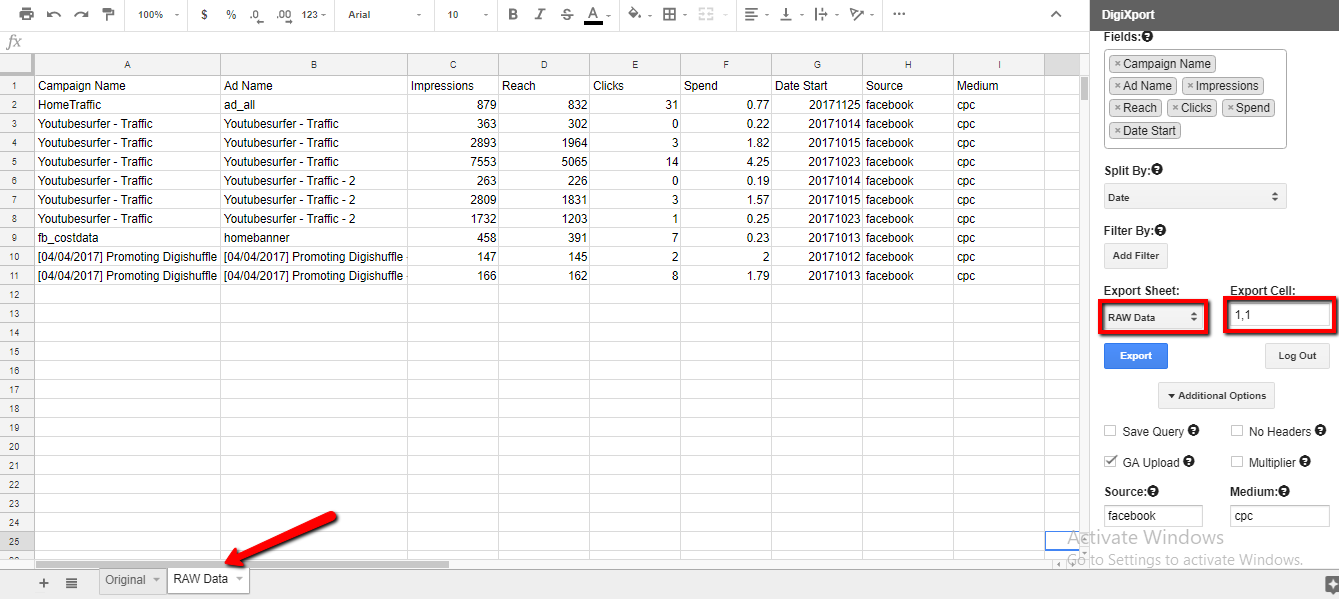
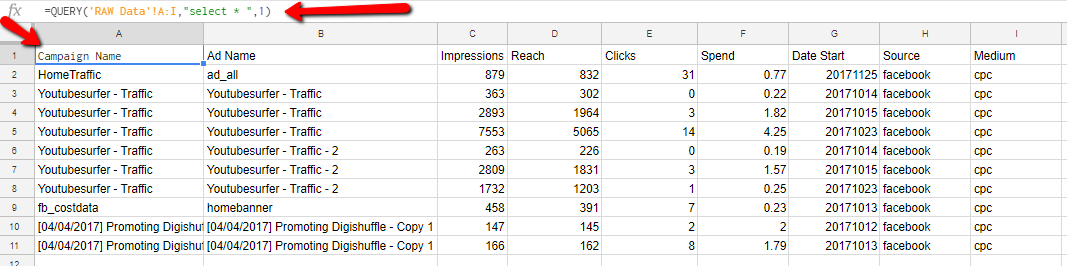
- In the Original Sheet, enter ‘=QUERY(‘RAW Data’!A:I,“select * “,1)’ in the cell 1,1.
- As we previously explained, RAW Data!A:I select the raw data sheet from column A To I. (All Rows)
- “select *” query represents to select all the columns & rows from the data range.
- 1 denoted there is a single header row.
Here’ what we get
Next, try these queries
- “select A,B,C“ – It will output columns A, B & C from the selected data range
- “select A,B,C order by C desc” – It will select column A,B & C & sort descending by Column C.
- “select A,B,C label A ‘Campaign New Title’ “– It will output columns A, B & C & rename the column A header to ‘Campaign New Title’.
Now, what you can do is use the keep the RAW data sheet as it is & change the other sheet via Query Function.
Here’s a great way to import the Facebook data into Google Analytics. (Delete the Reach column from the RAW Sheet)
Use this on cell 1,1 in Original sheet
=QUERY(‘RAW Data’!A:H,“select * label A ‘ga:campaign’, B ‘ga:adContent’, C ‘ga:impressions’, D ‘ga:adClicks’, E ‘ga:adCost’ , F ‘ga:date’ , G ‘ga:source’, H ‘ga:medium’ “,1)
Query Explanation:
- select * – This part will query all the columns
- label A ‘ga:campaign’, B ‘ga:adContent’, C ‘ga:impressions’, D ‘ga:adClicks’, E ‘ga:adCost’ , F ‘ga:date’ , G ‘ga:source’, H ‘ga:medium’ – This part will label the columns A as ga:campaign, B as ga:adContent & so on…

- Now you can upload the data to google analytics which is on the Original sheet.
- Every time you export the data from digiXport to the RAW sheet, the original sheet will get updated with the GA Upload header part.
- Always keep the RAW sheet untouched & work on the new sheet via importing it with Query Language.
Let’s look at the process.
- Export the data in the RAW Sheet.
- In your Original sheet, you can use the Query Function to modify the data in the RAW sheet.
- In the below example, you can see how the data headers are modified in the original sheet by using Query function.
- Also, When exporting new data to the Raw sheet, the data in the Original sheet will be modified as per the Query.
How To Use Reporting Templates?
for Facebook & Bing Ads Data
NOTE: This is a basic walkthrough of what can be done via QUERY function in the spreadsheet.
Let’s look at more use cases of Query function esp. for creating reporting templates.
Facebook Ads Reports Template
Here, The data is exported to the RAW sheet with the following fields
- Campaign Name
- Ad Name
- Impressions
- Clicks
- Spend
- Reach

Now, In the Original Sheet the query has been used to filter only Reach & Spend Column.
Here is the Query in the cell (A1) for comparing Reach vs Spend
=QUERY(‘RAW Data’!A:F,“select A,sum(D),sum(F) group by A order by sum(D) desc”,–1)
Query Explanation:
- select A,sum(D),sum(F) group by A – This part will group the Column A (Campaign Name) & sum the Columns D (Reach) & F (Spend).
- order by Sum(F) desc – This part will sort the column by the Sum(E) (which is Spend Column)
Here is the Query in the cell (E1) for comparing Impressions vs Clicks
=QUERY(‘RAW Data’!A:F,“select A,sum(C),sum(E) group by A order by sum(E) desc”,–1)
Query Explanation:
- select A,sum(C),sum(E) group by A – This part will group the Column A (Campaign Name) & sum the Column C & E.
- order by sum(E) desc – This part will group sort the Sum(E) column (Clicks Column) descending.
Also, you can add charts to display the table data.
Now, Every time you export the data in the RAW sheet the report in the Original sheet will get updated.
Here’s the report:

Bind Ads Reporting Template
Similar methods can be used as described above. Let’s take an use case. The report has been exported to let’s say, ‘RAW sheet2’ with the following fields
- Date
- Campaign
- Impressions
- Clicks
- Spend
- CTR
- Conversions
Below is the RAW Bing sheet.

Now, in the Bing Reporting Sheet we have used some QUERY functions to generate the below report.
Let’s go through them one by one.

Here are the QUERY function used in the respective cells.
- A1 – select A,sum(E),sum(D),sum(G) group by A order by A desc label sum(E) ‘Spend’, sum(D) ‘Clicks’,sum(G) ‘Conv’
- F1 – select sum(C) label sum(C) ‘Total Impressions’
- I1 – select sum(D) label sum(D) ‘Total Clicks’
- F6 – select sum(E) label sum(E) ‘Total Spend’
- I6 – select sum(D)/sum(C) label sum(D)/sum(C) ‘CTR’
- L1 – select B,sum(E) group by B order by sum(E) desc label sum(E) ‘Total Spend’
As soon as the new data is exported in the RAW sheet, the values in the Reporting sheet will change dynamically.
You can check out more docs on the Query Language here.
If you are a data studio user, follow the below steps.
Import Data To Data Studio
You can simply use the RAW sheet as a data source to the Google Data Studio. After that you can use the variety of charts from its library.
IMP: Make sure to export date column, as this will help you to use the Date selection feature in the Data Studio.
Follow these steps to start exporting the data.
1.) Select The Data Source as RAW Sheet


Once you have imported the data source, all the available headers would be populated in the data tab.
Makes sure to add the Date column to the Date Dimension. (This would help if you are using the Date Selection feature in the data studio)
You can add the metrics such as Impressions, Clicks, Ctr, Spend, etc in the Metrics Column as per the report type.

You can even use sample templates to get a feel for the data studio reports & its features. It’s a simple drag & drop tool.
For more info, check out this video at the bottom of this page.
Here’s a sample dashboard.
