Last Updated on October 13, 2020 by Ritwik B
Understanding Google Analytics Reports Types & Hierarchy is crucial to pinpoint the exact report which will answer your questions.
You might have some questions like
- How many users converted after downloading the PDF?
- What is the conversion rate of the users from City X?
- Which pages have Lower/Higher bounce Rates?
- What is the AdWords CPA for Mobile?
- & so on…
Some of these questions can be answered with pre-defined reports, custom reports or using segments on these reports.
But what should you use..?? & How to figure out ASAP which reports to look at?
Yes. you’ll figure that out after reading this article.
In this article, we’ll understand
- Google Analytics Report Types & Structure
- Google Analytics Metrics Structure
- Predefined / Default Reports
- Custom Reports
- Saved Reports
Google Analytics Report Types & Structure
What are the different types of google analytics report & How is the structure defined?
Let’s first understand how google analytics has defined these report structure. So basically, there are 3 report types
- Standard (Default) Reports
- Custom Reports
- Saved Reports
Pre-Defined Or Default Reports are available in the Reports Section in Google Analytics while Custom & Saved Reports are available in “Customization Section”.
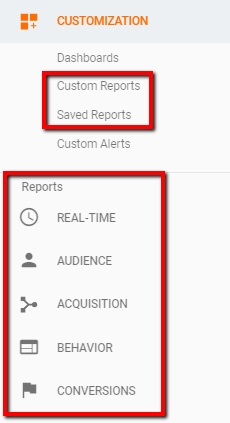
Standard (Default) Reports are further categorized into
- Real Time Reports
- Audience Reports
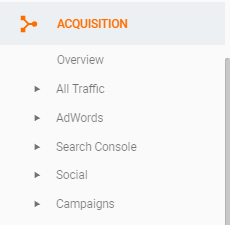
- Acquisition Reports
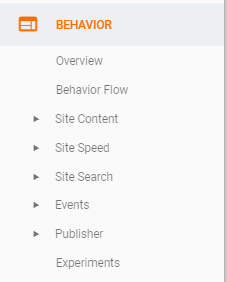
- Behavior Reports
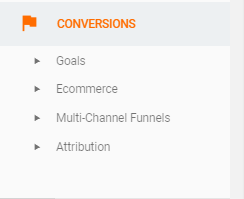
- Conversion Reports
Here’s the google analytics report hierarchy

Google Analytics Metrics Structure
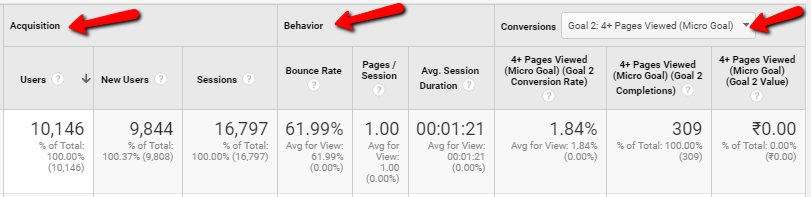
Google analytics uses ABC metric structure for most of the reports. These are:
Acquisition Metrics: These metrics focus on volume of users coming to your website.
- Users
- New Users
- Sessions
Behavior Metrics: These metrics focus on how well users engage on your website.
- Bounce Rate
- Pages / Sessions
- Avg. Session Duration
Conversion Metrics: These metrics focus on the Goals.
- Goal Conversion Rate
- Goal Completions
- Goal Value
Here’s what it looks
Standard (Default) Reports in Google Analytics
1.) Real Time Reports
Real-time reports in google analytics can show you live users, events & goals occurring on your website
They can also help you test if your google analytics tracking code is working or not.
Also, you can use these reports to
- Verify your UTM params via Traffic Source Reports
- Verify Event Tracking & its naming convention via Events Report
- Verify Goal Tracking via Conversions Report
- & also to see how many users are present currently on your website.
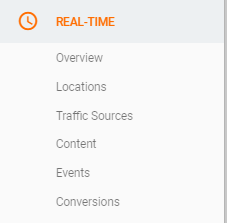
You can see various reports in this category
- Overview
- Location
- Traffic Sources
- Content
- Events
- Conversions
The most useful I have found till now is Content, Events & Conversions.
Here’s the content report.
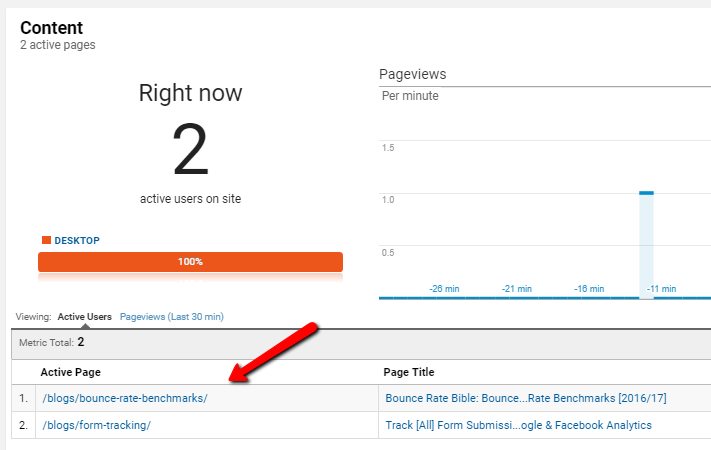
Importance:
- You can identify the pages which are not getting tracked in google analytics.
- You can verify the URLs & page titles getting tracked
Next, is the Events Reports. This report will show you the live events getting tracked in google analytics property.
Note: Only Interaction Events will be counted in Active Users
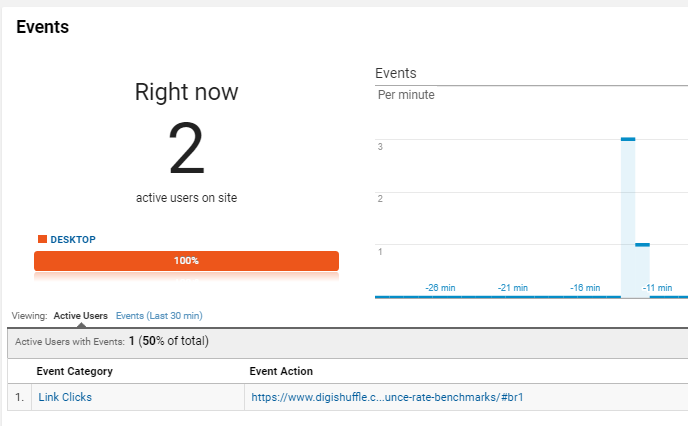
Importance:
- You can use this report to verify the event tracking setup done via GTM or GA.
- You can verify the values getting captured properly.
- These values can also be used for setting Event based goals.
The last report is Conversions report. Here, you can view the Goals getting tracked in real time.
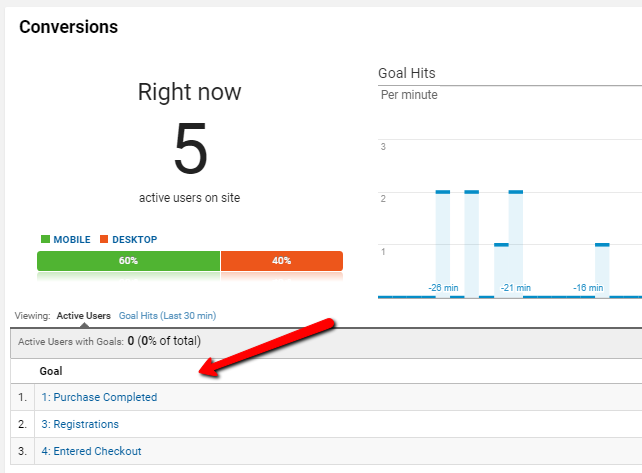
Importance:
- You can view this report to verify your Goals Setup.
- If your goals are not getting tracked in real time here, they will not be reflected in your normal reports.
2.) Audience Reports
As the name suggests,
Audiences in Analytics are users that you group together based on any combination of attributes that is meaningful to your business.
Audience Reports in Google Analytics will answer queries related to “Users: Properties”.
Some of the questions that can be answered in these reports are
- What’s the user’s location?
- How many active users are there on your website? (daily/weekly/monthly)
- What are the age/gender statistics?
- What are their interests?
- What device are they using?
- Is the user new or returning?
- & so on…
You can see there’s ample amount of information about the user available in google analytics.
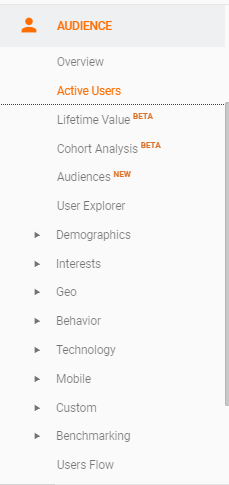
Let’s take a look at the reports available in Audience Section
1.) Overview Report
The overview report gives a summary of some of the important metrics of your website. These metrics are Acquisition & Engagement Metrics.
Acquisition Metrics
- Users
- New Users
- Sessions
Engagement Metrics
- Sessions / User
- Pageviews
- Pages / Sessions
- Avg. Session Duration
- Bounce Rate
This report will show you the data as per the date range applied.
2.) Active Users Report
This report will tell you the number of active users on your site for a selected date range. In this report, you can get
- 1 Day-active Users
- 7 Day Active Users
- 14 Day Active Users
- 28 Day Active Users
This report is more meaningful when the segments are applied. It will help you visualize the consistency of the sessions in a particular segment.
3.) Lifetime Value Report
Lifetime Value Reports are useful to gauge the performance of users for multiple sessions in their lifetime.
These reports are more useful for E-commerce sites. Also, other criteria are you need to have e-commerce tracking setup.
Currently, the only dimensions available in these reports are
- Acquisition Channel
- Acquisition Source
- Acquisition Medium
- Acquisition Campaign
You can compare the lifetime value of users based on the source from which they were acquired.
This will help re-allocating the budget for marketing.
4.) Cohort Analysis Report
Cohort analysis report will give you the analysis of the selected cohorts. The cohort is simply the group of users with similar characteristics.
Currently, There’s only one cohort type available & that is “Acquisition Date”.
This report is also useful for analyzing the retention of users over different time frames.
5.) Audiences Report
To get the data, you first need to Enable the demographics & Interests > Create an audience list & then publish it to Google Analytics.
The stats for that list will get reflected in the Audience report starting from the published date.
One of the good examples is to create an audience list for Micro Conversions. Eg: Users who downloaded PDF but didn’t sign up for the trial. Or Users Who added the product to Cart but Didn’t make a purchase.
6.) User Explorer Report
This report focuses on the behavior of the individual user on your website based on Client ID or User ID.
7.) Demographics & Interests Report
You need to enable this setting from the property settings in GA. The data for these reports is collected via double-click cookie.
This report will give you the information about the age-gender & interests of the website user. This would be useful to tailor the ads to specific audience demographics & interests having higher conversion rates.
8.) Geo Report
As the name suggests, Geo reports will give you the location data of the users based on their IP addresses.
There’s also a browser language report included in the geo report. This is useful if you have international users on your website.
9.) Behavior Report
This is one of the important reports in google analytics. It will give you stats for the new & returning users & also their stickiness to your website.
10.) Technology Report
This report will help you analyze the user based on the technology they use to visit your website.
It will contain stats segmented by
- Browser
- OS
- Network
- Screen Resolution
- Hostname
11.) Mobile Report
Mobile Report contains the stats related to different types of mobile devices, Mobile OS & more
12.) Custom Report
Previously, we used custom variables for defining different scopes. Now you can use custom dimensions & metrics instead of this report.
13.) Benchmarking Report
This report will provide valuable insights from other competitor websites. It will help you compare some of the metrics with the industry standards.
14.) User flow Report
User flow report in a type of Flow report in google analytics. It will help you visualize how the user navigates through your website.
3.) Acquisition Reports
As the name suggests,
Acquisition Reports in Google Analytics will answer queries related to “Users: While entering the website”.
Some of the questions that can be answered are
- Where did we acquire users from?
- What was the Channel?
- What were the keywords/search queries of acquired users?
- What was the cost of acquisition?
- & so on…
Acquisition reports focus on “How you acquire users” & its related information.
Let’s just quickly go through some of the reports available:
1.) Overview Report
This report will give you the summary of Acquisition, Behavior & Conversion metrics for different channels.
2.) All Traffic Report
All Traffic report will give you stats related to the different source, medium, channels, referrals & more…
You can use this report to gain the overall view of where your users are coming from.
3.) Adwords Report
Adwords reports will give you stats related to your Google Adwords. You will need to integrate your AdWords account with analytics before you start getting the data.
4.) Search Console Report
In this report, you’ll get Google search console/webmasters data.
Similar to AdWords, you’ll need to integrate Google search console to Google Analytics
5.) Social Report
Social Reports will give you stats related to users referred by the social networks.
6.) Campaign Report
This report useful when you are using UTM tags in your ad URLs.
These report will give you stats related to users referred by particular campaigns. Also, you can compare performance for a different keyword.
4.) Behavior Reports
Behavior reports in google analytics will answer queries related to “Users: After entering your website”
These reports are crucial to understanding the engagement metrics. Some of the questions that can be answered are:
- Which pages do users visit on your website?
- What is the page load time for the user?
- What do users search on the site?
- What pages do the users enter & exit?
- & so on…
Let’s look at the reports in this section & summarize:
1.) Overview Report
Overview report will give you insights related to the pages visited by users. some of the metrics available are
- Pageviews
- Unique Pageviews
- Avg. Time On Page
- Bounce Rate
- % Exit
2.) Behavior Flow Report
Behavior flow is another type of “flow” report in google analytics.
It will visualize the path of users via
- Pages
- Events
- Pages & Events
This report will help you find which pages users spend more time on & also the other content issues
3.) Site Content Report
Site content reports will give you stats related to “pages” visited by users. Some questions answered are:
- What are the pageviews for different pages
- What are the landing pages & exit pages
- Which pages have more time on page?
- Which pages have more bounce rates?
This is one the most important sections in google analytics.
4.) Site Speed Report
Site Speed report will give you page-load time for sample page views on your website.
It will also give you other site timings like DOM load time, Server Response & Redirection timings & more.
5.) Site Search Report
To populate this report, you’ll need to enable site search in the view settings. IT will give you stats related to
- The search terms used in the site search on the website.
- Pages viewed after the search
- % Search refinements
- Time spent after the search
- & more…
Remember, You’ll have to implement the site search tracking if you don’t have any search query parameter in the URL.
6.) Event Report
Event Report will report all the custom events tracked via gtag.js / analytics.js or GTM.
The events tracked can be link clicks, subscription, free signup, purchase & more.
7.) Publisher Report
This is a useful report if you have monetized your websites with some publishers.
You’ll have to connect Adsense or ad exchange with your analytics property to populate this report. Some metrics you can get are impressions, clicks, revenue & more
8.) Experiments Report
This reports will give you stats related to the experiments which you ran in Google Optimize.
The old content experiment by analytics has been deprecated & replaced with the new A/B testing tool Google Optimize.
To populate this report you’ll need to connect google optimize to analytics.
5.) Conversion Reports
As the name suggests,
Conversion Reports in Google Analytics will answer the queries related to the “Goals” defined by you.
Some of the questions answered by these reports are
- What is the Goal Conversion Rate of your website?
- How many days/visits does user take to convert on my website?
- What are the channels used by the user before converting?
- What is my transaction rate & revenue?
In order to populate these reports, the first thing you should do is
- Define Goal
Or - Enable & Implement E-commerce or Enhanced E-commerce Tracking
Let’s look at the report summary in this section
1.) Goal Report
Goal report will help you with some important metrics like Goal completion & goal completion Rate. It also contains the funnel visualization report.
To populate this report, make sure to define goals in view settings.
2.) E-commerce Report
If you have an e-commerce site, it is recommended to implement e-commerce site tracking & enable e-commerce reports.
You can get some important metrics such as revenue, transaction rate, avg. order value & more.
3.) Multi-Channel Funnels Report
These reports will give you more in-depth analysis of the goals. It will give you
- The different channels users interacted before converting
- The time in days it took for conversion to occur.
- The number of channel interaction before conversion
- & more
This report is the actual gold mine for every digital analyst. You can re-allocate marketing budgets according to the channel contribution towards conversion.
4.) Attribution Report
Attribution reports can help you compare different attribution models in a single table interface.
It can give you the valuation of each marketing channel. For more info, check here
Custom Reports in Google Analytics
Custom reports are a must for every business.
Every business & campaigns that you run has different goals & KPIs. Based on these, you can create custom reports which are much more powerful than pre-defined reports
Creating custom reports is no big deal. You can simply go to Customization > custom reports & click on create one.
After you create one you can directly import the ones available or you can manually put the metrics.
Here’s how you can import some of the samples:
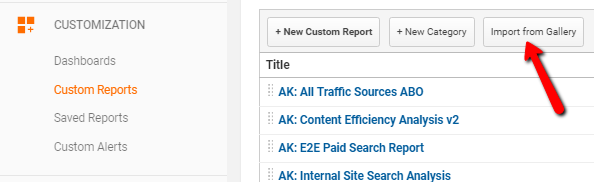

By far, Custom reports are more powerful as you get more control over the dimensions & metrics.
Here’s the list of all the dimension & metrics available in Google Analytics.
To learn more about How to create custom reports, check here.
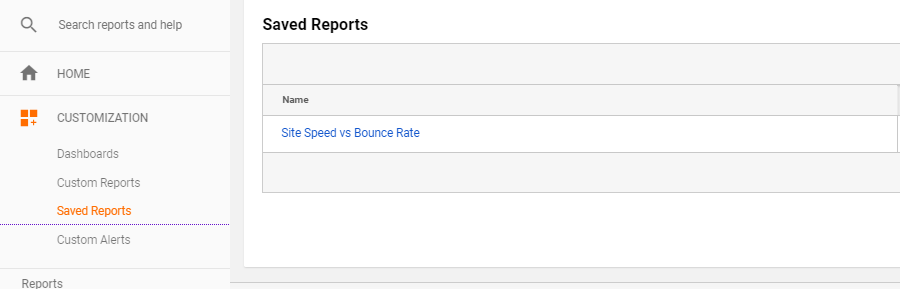
Saved Reports in Google Analytics
Saved Reports will help you get faster access to the reports you need often.
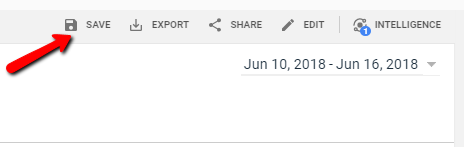
You can click “Save” icon on any pre-defined or custom report & these reports will appear in the Customization Section.
All the settings which you apply to the predefined or custom reports are saved including
- Segments
- New Calculated Metrics
- Report Structure & Configuration
Only the date range is not saved which you can apply it later.
You can use these reports to check your important KPI metrics on daily basis. That’ll help you save ample amount of time.
Important Points
Understanding the google analytics structure is crucial only if you want to master the google analytics.
If you’re just looking to answer your query you have 2 options. You can utilize
- Analytics Intelligence
- Report Search Feature
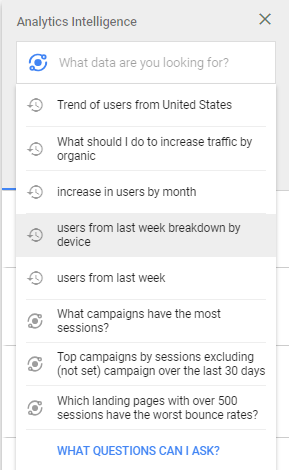
Analytics Intelligence can help you quickly find answers for most of your queries.
You just need to ask google analytics for your query & BAM.!! You get an answer.
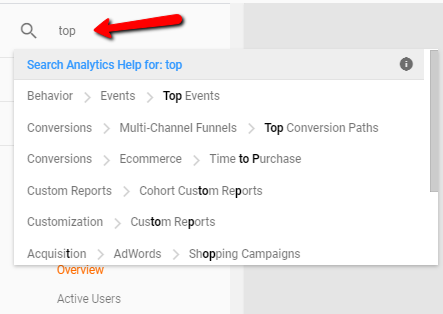
To utilize “Report Search” feature, you can remember the names of Pre-defined / Default Reports in Google Analytics. Just search for the report name & click on the report you need.
I would suggest writing down all the queries on the sheet. Find those reports in google analytics > Save those reports for daily use.
FAQs
Standard Reports are the pre-defined reports available in Google Analytics. They are categorized into:
- Real-Time Reports
- Audience Reports
- Acquisition Reports
- Behavior Reports
- Conversion Reports
Audiences in Analytics are users that you group together based on any combination of attributes that is meaningful to your business. Audience Reports in Google Analytics will answer queries related to “Users: Properties”.
Some of the questions that can be answered in these reports are
- What’s the user’s location?
- How many active users are there on your website? (daily/weekly/monthly)
- What are the age/gender statistics?
- What are their interests?
- What device are they using?
- Is the user new or returning?
- & so on…
A Custom Report is a report which is created manually by combining the dimensions and metrics available in Google Analytics. Users can also choose how to display these reports in the dashboard.
Real-time reports in google analytics can show you live users, events & goals occurring on your website
Ritwik is a Web Analyst & Product Marketer. He loves to write technical & easy to understand blogs for Marketers & Entrepreneurs. Focused on Google Analytics, Facebook Analytics, Tag Management, Marketing & Automation Scripts & more. Google Certified Professional. A Firm Believer in Teaching -> Learning -> Growing. :)