Let’s say you have a new Ecommerce startup. You are exited & have told your family & friends about it.
In the initial month you receive very good traffic & also some revenues too.
Guess What happens in a month or two..?

Your friends & family don’t necessary mean your loyal customer.
If you are in Gaming , SaaS, Fintech , etc business it’s very important to maintain the initial customers for long duration.
Inspite of the fact that customer churn is inevitable we can always take a data driven approach.
That’s where you can use Cohort Analysis.
So, What is Cohort Analysis ?
Let’s 1st understand what is cohort. Cohort is simply:
Group of users having some common characteristics in a specified time period.
Eg:
- Users having acquisition date as 12-12-2017.
- Users having acquisition source as Organic.
- Users having XX acquisition city, etc
Cohort analysis is analysis of these buckets of users.
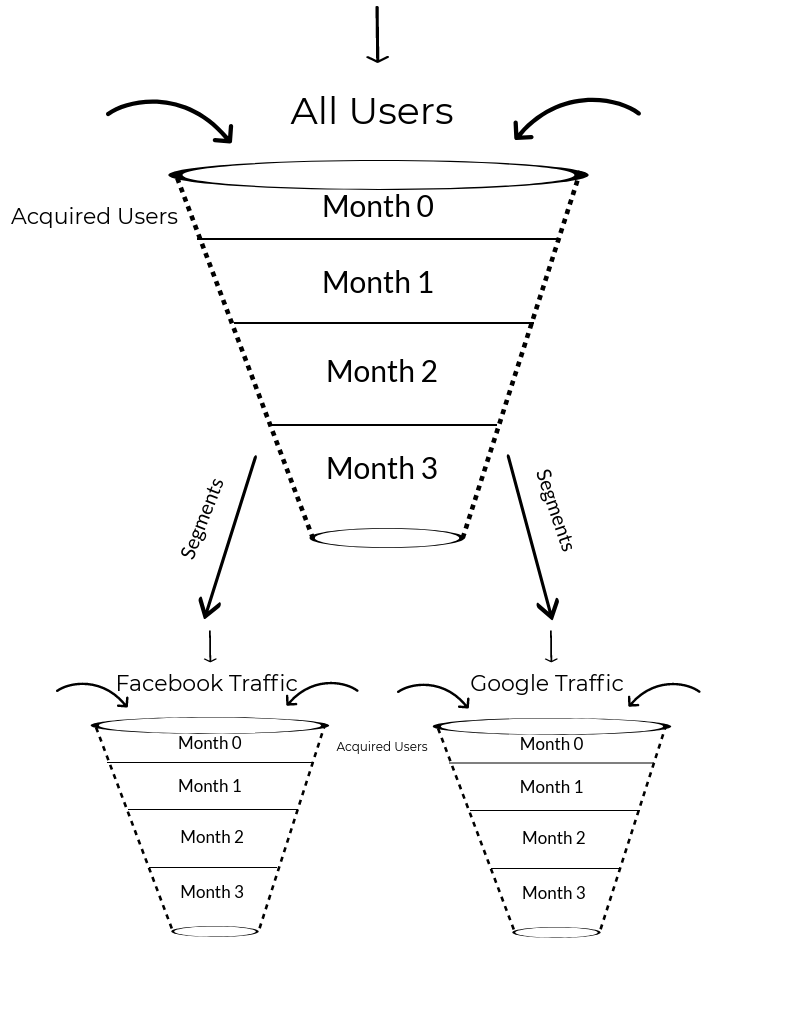
Think of it as a Time Funnel.

In the above funnel:
- Month 0 – Month of acquisition
- Month 1 – Next Month (following acquisition month)
- Month 2 – Next To Next Month & so on..
It is a must use report for startups to know the churn rate & period of the customers for your business.
Always segment the users in order to understand behavior of different cohorts.
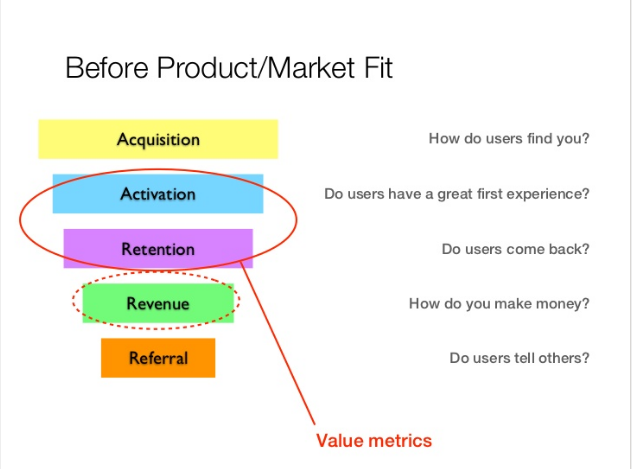
Also, after product market fit, one of the focus for any business should be to
- Reduce the user churn rate &
- Increase relevant user acquisitions.
So, Why should a Startup be worried about Cohort Analysis Reports?
1.) Confirm Product Market Fit
If you have a mobile app or website in Gaming, Saas, Fintech, Ecommerce ,etc niche, make sure users are engaging with your product.
Make a list of
- Most used feature.
- Least used feature.
- Time spent per visit
- Pages/Screens viewed per visit
- Frequency of visits/day, visits/week, etc.
At initial stages, you can run a test campaign & acquire some users.
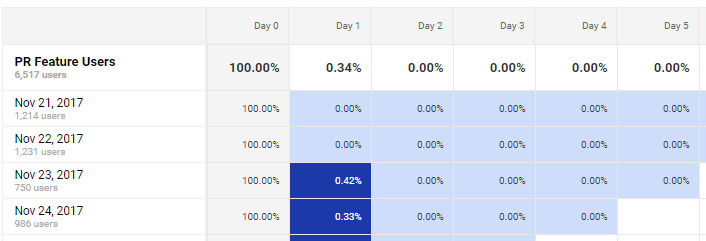
You can then check the Cohort Reports in Google Analytics to see if they come back & engage.

Lets say we acquire 17,109 users in the week of Oct 15 – Oct 21, 2017.
- We see the following week (week 1) had 3.57% users of the acquired cohort. i.e 17109*3.57/100 ~ 611 users.
- The next to next week (week 2) had 1.91%. 17,109 * 1.91/100 ~327 users.
- & so on…
Its often alarming if you see sudden drop in next week.

To deep dive, you can also check the frequency & recency report in google analytics to know the count of visits. (Take longer date range)
If the users for count of session 2+ or 3+ are 0, then you might have to recheck your product.

Make to sure to keep an eye on these reports.
2.) Unique Feature/Product Engagement
Every business has a unique selling point.
- SaaS – It might be a unique feature, pricing, subscription models & so on..
- Ecommerce – It might be a unique category products, or low shipping charges, etc
- Fintech – Speed of excecution, Low commission rates, etc
Analyze the same segment cohort in google analytics.

If very few users are engaging with your category pages or a particular feature & not returning back, then it is alarming.
Make sure to segment it for all your major features.
You might also find out that users are engaging with some other features/products. & that might replace your key feature.
3.) Remarketing Churned Users
Even if the user has not returned to your website for long time, it does not always mean he/she didn’t like your website.
There may be various reasons like
- Not planning to buy now.
- Didn’t had a feature/product needed.
- Landing page CTA was not proper.
- Bad UI/UX experience on different devices.
- and so on…
There are 2 types of users on your site
- Anonymous – Users who didn’t submit any email or phone no. on your site.
- Non-Anonymous – Users who have already submitted email or phone no.
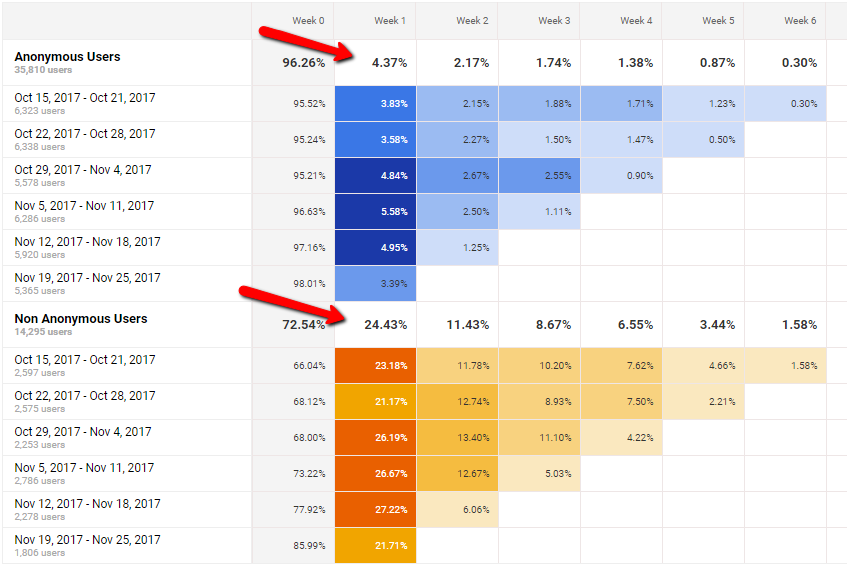
So assuming conversion rate to be 2-3%, we might have around remaining 97-98% Anonymous users.
Let’s segment these & check the cohort reports.

Its essential to employ remarketing strategies for these 2 users depending on their attrition period
You might observer that the non – anonymous users tend to better engage with your product as compared to anonymous users.
For non – anonymous users:
- From Week 1 to Week 2 & Week 4 to Week 5, we see a large user drop.
- We can plan to remarket the users just after the second week.
- We can deploy email marketing, SMS or push notifications, discounted offers, search/display remarketing ads etc for these users.
- These users tend to be more converting than anonymous users.
For anonymous users:
- We see a similar max drop of for Week 1 to 2 & Week 4 to 5.
- We can remarket these users via Search ads, display ads, facebook ads, other social network ads, dynamic remarketing, etc
Important Points
- Check your product market fit. Make sure the users are re-engaging with your product/website.
- Segment the users based on the features used. Check if they are returning & engaging with your product/website.
- Always remarket the users after the max cohort drop off.
Ritwik is a Web Analyst & Product Marketer. He loves to write technical & easy to understand blogs for Marketers & Entrepreneurs. Focused on Google Analytics, Facebook Analytics, Tag Management, Marketing & Automation Scripts & more. Google Certified Professional. A Firm Believer in Teaching -> Learning -> Growing. :)
